

Debug logs are a very important tool for any Salesforce administrators and Developers. Debug logs capture detailed information about code execution, automation rules, API calls, and more, helping us identify issues, understand the execution flow, and optimise performance. In this blog, we’ll explore how to enable debug logs, generate them, and analyse them effectively.
This blog offers a clear, step-by-step guide to help you navigate common challenges in Salesforce. Whether you’re troubleshooting Apex errors, investigating issues in Flows, or tracking integration activities. It’s designed to make the debugging process easier to understand and apply, regardless of your experience level.
What are Debug Logs?
A debug log is a detailed, timestamped record of system events in Salesforce, including:
- Apex execution (classes, triggers)
- Flow interviews and Process Builder actions
- Validation rules and workflow rules
- SOQL queries and DML operations
- Callouts to external services
- Governor limits usage
Each log entry includes the context (user, transaction ID), event type, log level and message. By reviewing these entries, we can be able to easily pinpoint where errors occur, how long operations take and which limits are being approached.
How to Enable Debug Logs in Salesforce
Before Salesforce can capture any debug information, we must tell it which users and which level of detail to record. This is done by creating a Trace Flag for a user and associating a Debug Level with that trace flag.
Steps to Enabling Debug Logs
1. Go to Setup by clicking on the gear icon.
2. In Quick Find, type Debug Logs, then select Debug Logs under the Logs section.
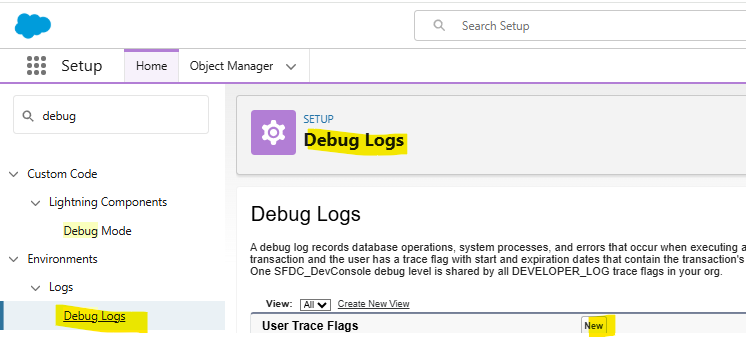
3. Set Up a Trace Flag
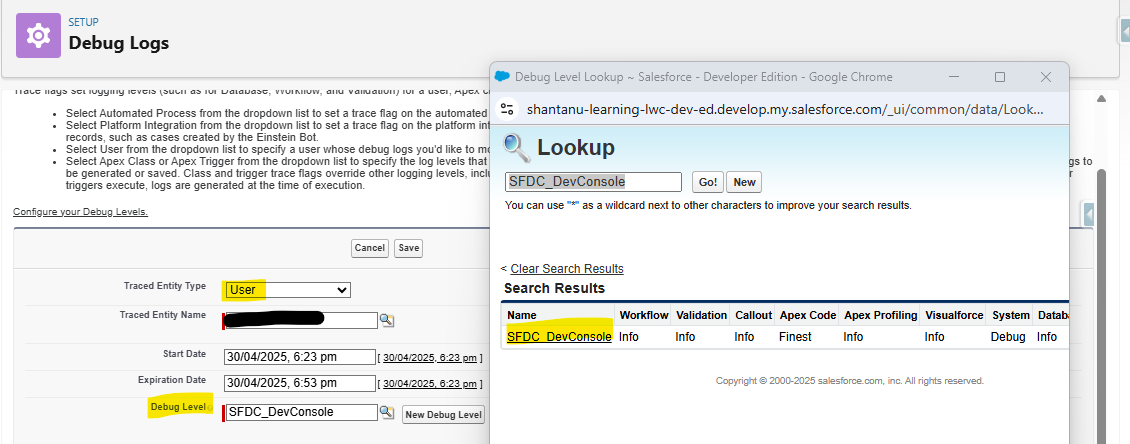
- Click New (or Add).
- Traced Entity Type: Select User.
- Traced Entity Name: Choose the user whose actions we want to log.
- Debug Level: Use the default or create a new one (see below).
- Start/Expiration Dates: Set a window (max 24 hours) during which logs will be captured.
- Click Save.
Creating a Custom Debug Level
A Debug Level defines the granularity of logs for different categories:
1. In Setup, search for Debug Levels.
2. Click New.
3. Give it a name (e.g., “VerboseAPIDebug”).
4. For each category Apex Code, Apex Profiling, Callout, Database, Validation and Workflow select a log level:
- ERROR: Only errors
- WARN: Warnings and errors
- INFO: Informational messages, warnings, errors
- FINE / FINER / FINEST: Increasing levels of detail for in-depth debugging. Click Save.
5. Click Save
How to Create Debug Logs
Once a trace flag is active for a user, any actions performed by that user generate debug logs automatically. There are no additional “Create” button logs as users interact with Salesforce.
Generating Logs
1. Log in as the traced user or have them operate we want to debug (e.g., save a record, run a Flow).
2. View Logs
- Return to Setup → Debug Logs.
- The table lists recent logs for that user, including:
- Log Type (e.g., Apex, Workflow)
- Date/Time
- Size
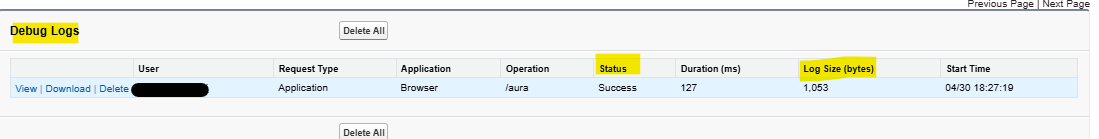
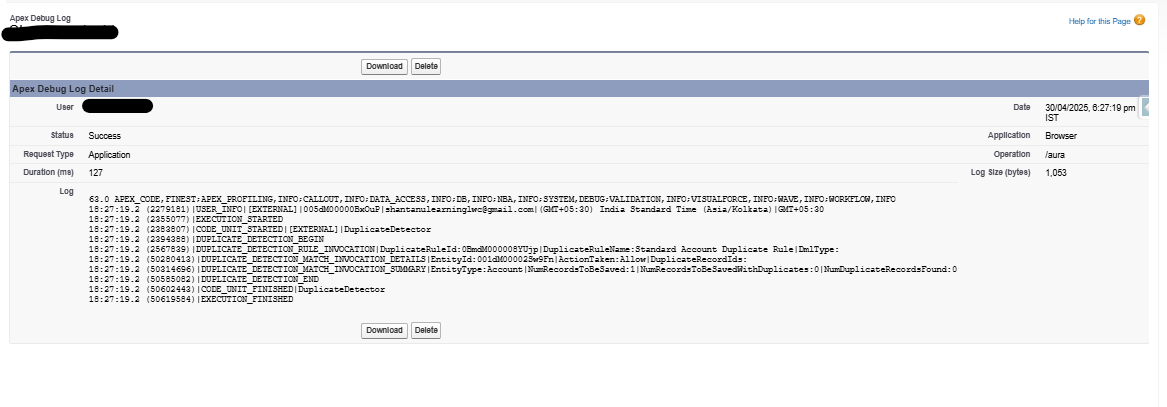
3. Download or Open
- Click Download to save the .log file locally.
- Click View to open it directly in the Salesforce UI.
Special Considerations
- API & Integration Calls: If an external system acts, ensure the integration user has an active trace flag.
- Batch and Queueable Jobs: Set a trace flag on the Automated Process user or the user that enqueues the batch.
- Flows & Process Builders: These appear under the Workflow and Flow categories in our logs.
How to Analyse Debug Logs
Debug logs can be lengthy, so a systematic approach makes analysis efficient. Below are key tactics and tools for interpreting logs.
1. Use the Developer Console
The Developer Console provides a structured view with filters and highlights:
- In Salesforce, click avatar (top right) → Developer Console.
- Debug → Open Execute Anonymous Window (if we want to run code).
- Logs tab → double-click a log entry.

2. Focus on Key Sections
| Consideration | Description |
|---|---|
| Field mapping and data ownership | Define clearly which fields are displayed in Salesforce and which system owns each data element. NetSuite should remain authoritative for financial values such as balances, invoices, and revenue recognition. |
| Transaction initiation rules | Establish clear logic for when Salesforce creates records in NetSuite. Avoid allowing duplicate or premature transaction creation. |
| Data quality controls | Ensure customer, product, and pricing records are standardized before synchronization. Inconsistent identifiers or incomplete records can create reconciliation issues. |
| Process governance | Define roles, permissions, and approval flows across CRM and ERP. Integration should respect financial controls and not bypass accounting validation. |
| Reporting alignment | Confirm that Salesforce dashboards reflect NetSuite financial data accurately. Differences in timing, currency handling, or tax calculations must be understood and documented. |
| Operational maintenance | Integration requires monitoring, version updates, and periodic review of mappings as business models evolve. It is not a “set once and forget” configuration. |
Use Ctrl + F with keywords like FATAL_ERROR, System.Callout, or specific class names, to jump straight to relevant entries.
3. Interpret Governor Limits
Salesforce enforces limits on resources. The LIMIT_USAGE section shows our consumption:
- CPU Time: High CPU suggests complex logic; consider optimisation.
- SOQL Count: SOQL queries in loops can quickly exhaust limits, bulkify!
- DML Statements: Ensure DML is outside loops or batched.
- Heap Size: Large collections or JSON parsing can inflate heap usage; stream data when possible.
4. Examine Callouts and External Integrations
If our transaction makes HTTP callouts, look for:
- Verify request URL, headers, and payload.
- Check for timeouts or non-200 response codes.
Best Practices for Debug Logging
- Use Targeted Trace Flags
- Only trace specific users or processes. Broad tracing slows performance and floods logs.
- Adjust Log Levels Dynamically
- Create multiple Debug Levels (e.g., “Debug_ApexOnly”, “Debug_Full”), and switch as needed.
- Clean Up Old Trace Flags
- Remove flags after troubleshooting to avoid unnecessary storage usage.
- Store Key Insights
- When we find a solution, document the relevant log snippets. This makes future debugging faster.
- Automate Alerts for Failures
- Implement APEX or Flow to monitor debug logs in a custom object and alert admins on FATAL_ERROR entries.
Also Read – Top Flow Features in Salesforce Summer ’25 Release
FAQs
1. What are Debug Logs in Salesforce?
Debug logs are logs that track events like database changes, system processes, and errors. They help developers and admins troubleshoot issues in code (Apex), workflows, validation rules, etc.
2. What is a Trace Flag?
A trace flag specifies which user, class, or trigger to monitor and for how long. It enables logging for a limited period.
3. How long are debug logs retained in Salesforce?
Salesforce keeps debug logs for up to 24 hours or until they hit 50 MB in size, whichever happens first.
Conclusion
Debug logs serve as a powerful tool for understanding the inner workings of Salesforce. They provide a detailed, step-by-step view of how code, automation, and integrations are executed behind the scenes.
By enabling the appropriate trace flags and debug levels, triggering logs through specific user actions or processes, and analysing them using tools like the Developer Console, we can uncover hidden issues, fine-tune performance, and validate our configurations with greater clarity.