


With the Summer ’25 release, Salesforce has completely redesigned the debug panel in Flows. It’s now cleaner, smarter and packed with features that make troubleshooting easier and faster.
In this blog, we’ll explore what’s new and why this upgrade is a game-changer for anyone working with Salesforce flows.
Why Debugging Matters in Salesforce Flows?
Automations in Salesforce often look perfect on the Flow canvas until you run them and realize something didn’t quite work. Let’s take a simple example: you’re building a Flow that updates the Loyalty Status field on the Contact based on the Origin of a newly created Case.
- If Origin is “Phone” → Loyalty = Diamond
- If Origin is “Email” → Loyalty = Gold
- If Origin is “Web” → Loyalty = Silver
Seems straightforward, right? But what happens if the Contact field is blank on the Case? Or the Origin value is misspelled? Or worse, the update silently fails without giving any feedback?
That’s exactly where the Summer ’25 Debug Panel comes in to make these “invisible issues” instantly visible.
The Flow Design: Mapping Case Origin to Contact’s Loyalty
In the flow below, we start with a Record-Triggered Flow on Case creation. A Decision element checks the Origin field, and based on that, the flow updates the related Contact’s Loyalty Status accordingly.
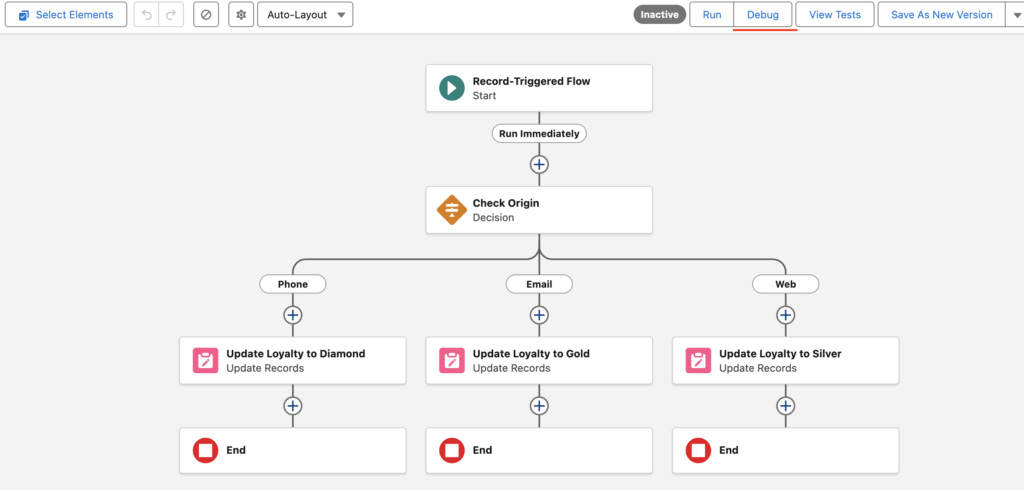
You can see the three clear paths: Phone → Diamond, Email → Gold, and Web → Silver.
This logic is clean. But what if the Case has no Contact linked?
The Real Problem: Silent Failures Without Error
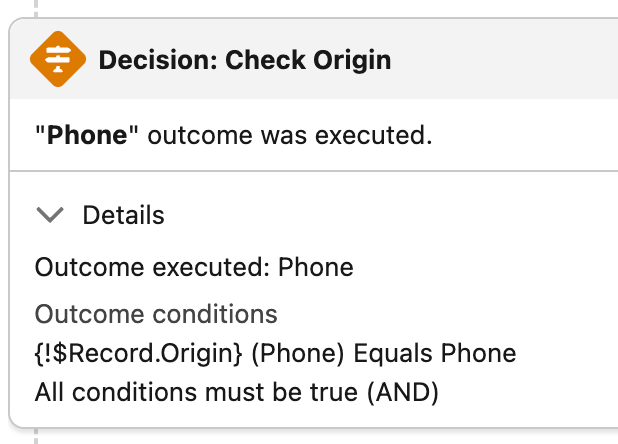
When we debug this flow with a test Case record, the flow runs perfectly if the Case has a Contact. But if the Contact lookup is blank, your Update Records element still runs but updates 0 records silently, without any error.
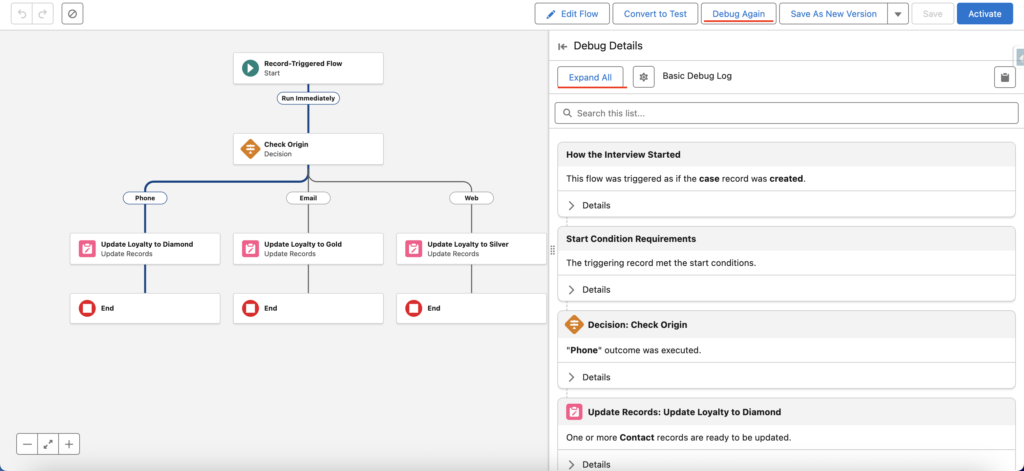
Here, the new Debug Panel clearly shows that the decision path (“Phone”) was taken, and which update element ran. This tells you:
- The Decision logic worked
- But no actual Contact was updated, hinting that either the ContactId was blank, or the update didn’t match any records.
This is crucial visibility that the old debug view lacked.
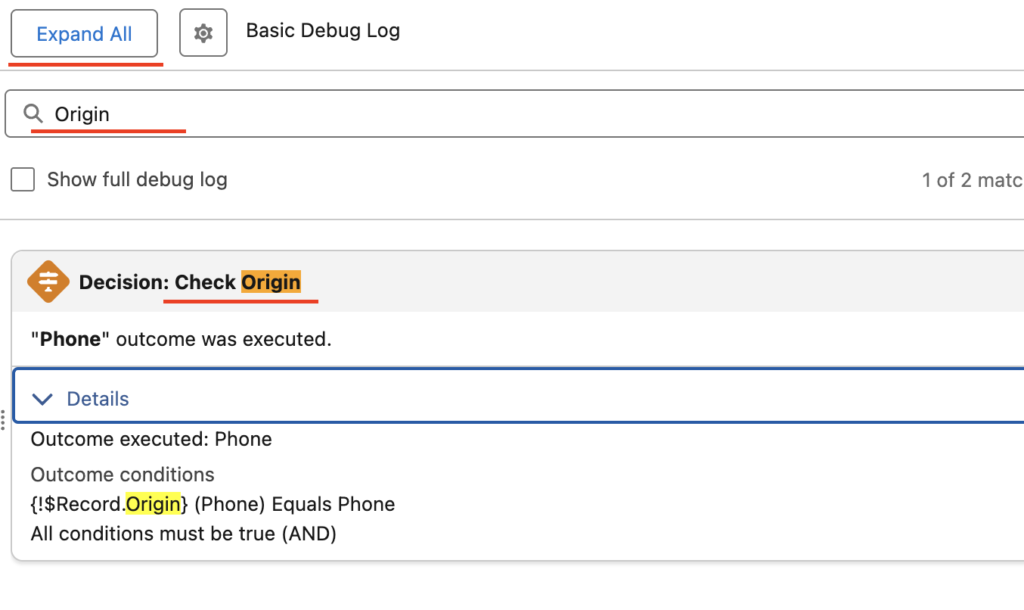
Debugging: Seeing the Condition Breakdown
You can even expand the card and inspect the input values used in the Decision logic, such as the exact Origin value passed and which path was taken.
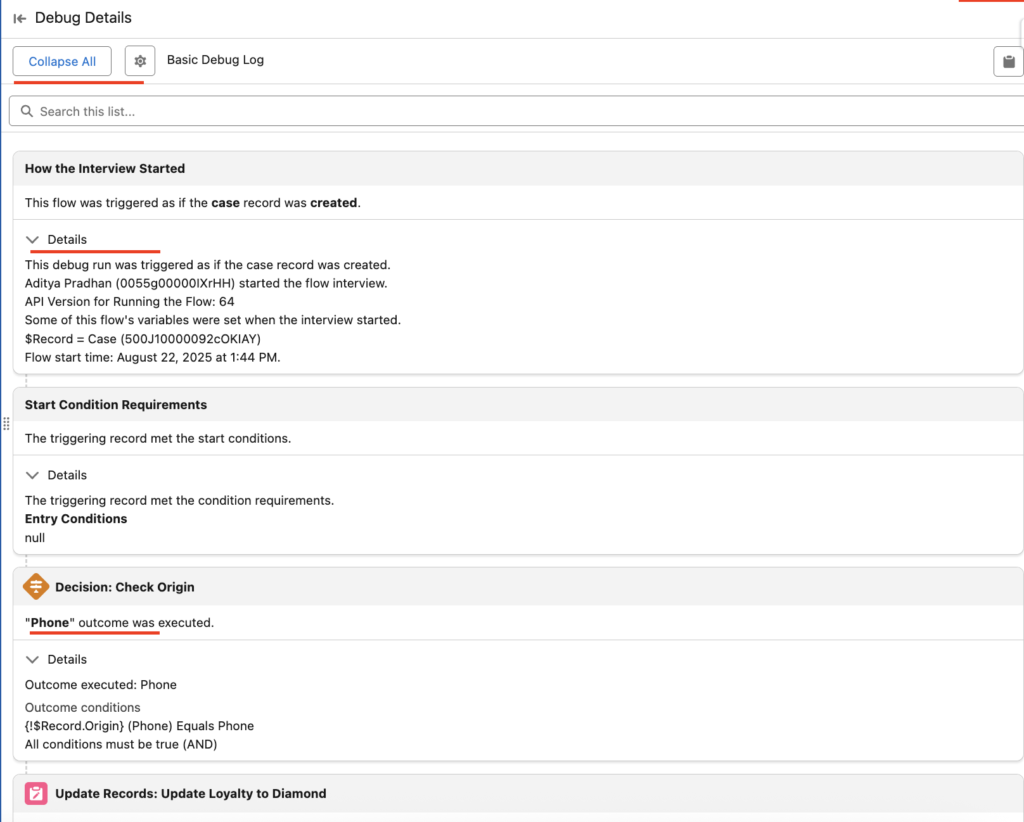
This level of detail helps you immediately pinpoint whether:
- The field logic failed
- A required value was null (like ContactId)
- Or the wrong outcome branch was followed
New Debug Panel Features
For anyone who’s worked with Salesforce Flows before, the old debug experience wasn’t exactly ideal. You’d hit “Debug,” wait for a log dump, and then scroll endlessly to figure out what happened or what didn’t. It worked, but it was clunky, slow, and easy to miss important details.
With the Summer ’25 release, Salesforce introduces a completely reimagined Debug Panel with features as follows
1. Card-Based Layout with Summary Lines
Each executed step in the flow is shown as a card, with a concise summary of what happened, like which outcome branch was taken, what record was found, or what update ran.
You no longer need to dig into logs to know what was executed. It’s visual, readable, and reflects the way your flow is actually built.
2. Input & Output Breakdown for Each Element
Each card lets you expand to view the inputs and outputs used during that step:
- What value was evaluated?
- What was the result?
- Which variable held what value?
You can spot mismatches (like null ContactId or misspelt picklist values) immediately without extra debug logs or guesswork.
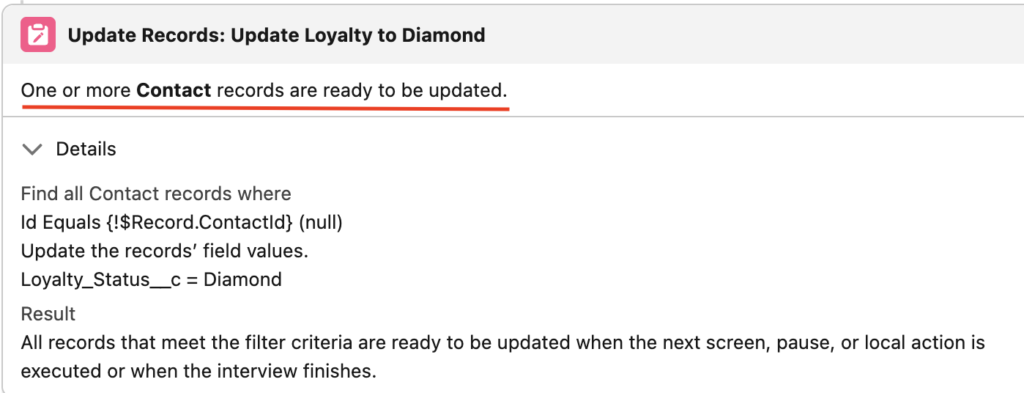
3. Record Matching Feedback in Update Records
Previously, if an Update Records element silently skipped because no records matched, you had no idea why.
Now, it tells you: “One or more records were ready to be updated.” OR “No records matched the conditions.”
You instantly know whether your update logic worked, or whether the ContactId was missing or filtered out.
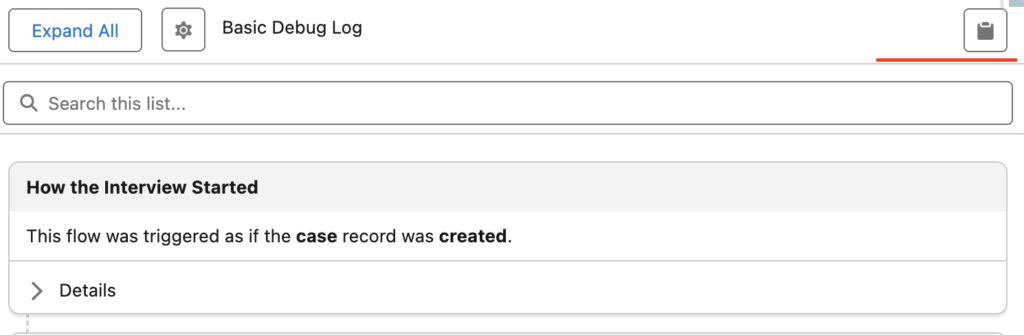
4. Expand All + Search Functionality
Click Expand All to open every debug section at once or use the search bar to jump to any field, variable, or element name.
Faster navigation, especially in flows with many assignments or nested decisions.
5. Copy-to-Clipboard Log Button
In the top-right corner of the debug panel, there’s a handy clipboard icon that lets you copy the full debug output in a readable format.
Perfect for sharing flow behavior with teammates, documenting test cases, or comparing before/after changes.
Also Read – Top Flow Features in Salesforce Winter ’26 Release
FAQs
1. What is the new debug panel in Salesforce Summer ’25?
The new debug panel is a redesigned interface in Flow Builder that visually breaks down each step of your flow execution using card-based summaries, making it easier to understand what happened, what ran, and what didn’t without digging through raw logs.
2. How is this different from the old debug experience?
Previously, debugging flows meant scrolling through long, text-heavy logs with minimal structure. The Summer ’25 version introduces a cleaner layout with expandable cards, real-time decision outcomes, record update results, and search functionality all in one place.
3. Can I use the new debug panel for Screen Flows?
As of Summer ’25, the new panel works with record-triggered flows and autolaunched flows. Support for Screen Flows is introduced in the Winter ’26 release, along with more improvements like canvas-based tracing and panel toggling.
4. Do I need to enable anything to use the new debug panel?
Nope! If you’re using Flow Builder in a Summer ’25 org (sandbox or preview), the new debug panel is already active for supported flow types. Just hit “Debug” and it will launch by default.
Conclusion
Salesforce’s Summer ’25 Debug Panel update is more than just a visual refresh; it’s a practical, time-saving upgrade that changes how we approach flow troubleshooting. With its card-based summaries, searchable interface, and clear execution tracking, debugging becomes less about guessing and more about understanding.
Whether you’re an admin building a simple update flow or a developer managing a complex automation, this new panel gives you the clarity and control you’ve always needed.