

Have you ever clicked on a Lightning page and wondered why some Lightning pages load faster than others?
Pages in Salesforce Lightning Experience load gradually, one component at a time. This implies that a page may take longer to render completely if it contains more subcomponents. Is there a method to check Lightning Page Load Time In Salesforce and enhance performance?
We can use Experienced Page Time (EPT) to accomplish this.
What Is Experienced Page Time (EPT)?
Salesforce utilises a performance indicator called Experienced Page Time (EPT) to measure how long it takes for a Lightning page to become fully interactive for the user.
EPT is measured in seconds, beginning when the website loads and ending when there is no more activity. It assists Salesforce developers and administrators in locating pages that load slowly and adjusting performance appropriately.
How to enable EPT in Salesforce?
EPT can be enabled in your Salesforce org in three ways:
Method 1: Using Debug Mode
- Click on the gear icon in your Salesforce org and go to Setup.
- Type ‘Debug Mode’ into the Quick Find box to access the Debug Mode settings.

- Choose the user you wish to enable EPT. Click the ‘Enable’ button.
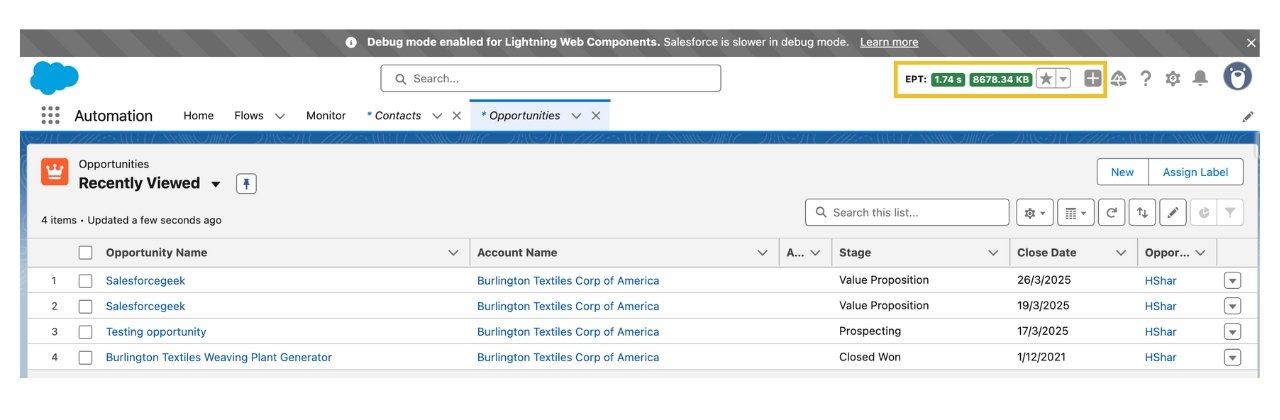
Once enabled, navigate to any Lightning page, and you’ll see the EPT calculations displayed.
Keep in mind that enabling this setting could slow things down a bit, as caching is disabled and the component code isn’t optimized.
Method 2: Adding a URL Parameter
If you don’t want to enable Debug Mode, there’s another way. Just append “?eptVisible=1” at the end of your page URL. This will display the EPT values directly on the page without enabling Debug Mode.
This will add a page load time counter to your Lightning Experience header, but it won’t show network bandwidth. Unlike Lightning Component Debug Mode, in this case, the component code stays optimized, so there is minimal impact on performance.
Method 3: Using the Lightning Usage App
- Click on the App Launcher and search ‘Lightning Usage App’

- Go to the Activity section, click on Page and check out the graph.

Several factors can impact the EPT value, some of them are:
- User’s browser and device hardware
- Network speed and quality
- The complexity of the Salesforce org (many custom fields and components)
- Component implementation, caching, and errors
- User interactions while the page is still loading
Also Read – 10+ Best Practices for Salesforce Flow
FAQs
1. How do I add an EPT in Salesforce?
There are three ways to enable EPT in your Salesforce org.
-
Using Debug Mode
-
Adding URL Parameter
- Using the Lightning Usage App
2. Why am I seeing the numbers at the right top corner in Lightning UI?
You’re seeing it because EPT is enabled in your Salesforce org. To verify, go to Setup and search for “Debug Mode”.
Conclusion
As a Salesforce admin or developer, tracking EPT can help you identify performance bottlenecks, optimize Lightning pages and enhance the user experience.