

Reports in Salesforce help users see what’s going on in their business. Whether it’s tracking sales, support cases, or custom data, an advanced Salesforce report feature turns raw records into useful, actionable insights.
While basic reports work well for simple needs, advanced Salesforce report features take reporting a step further. They let users group, filter, and visualise data in smarter ways. With advanced features like custom report types, formulas, and cross filters, more specific questions can be answered without writing any code.
In this blog, we’ll explore the key advanced Salesforce report feature tools Salesforce offers and how they can help you make better decisions, faster.
1. Custom Report Type
What is a Custom Report Type?
Custom Report Types in Salesforce let users go beyond default reporting limits. Instead of just reporting on a single object or basic related records, custom report types define exactly which objects and fields should be included.
They are created when standard report types don’t fit your business needs, such as when pulling data from custom objects or when showing fields from more than two related objects. With them, users can choose which relationships matter and which fields should be available in the report builder.
For example, if Opportunities and a custom object called “Contracts” need to be shown in one report, a custom report type can make that possible.
Another use case could be reporting on Students (custom object), their related Course Enrollments (lookup custom object), and linked Instructors (lookup custom object).
Example with Steps to Create a Custom Report Type
Let’s start with the use case where you want to see how many students each instructor is handling. A custom report type makes it easy to break down this information even when the data lives across multiple related objects.
Steps: Create the Custom Report Type
- Go to Setup → search for and select “Report Types”
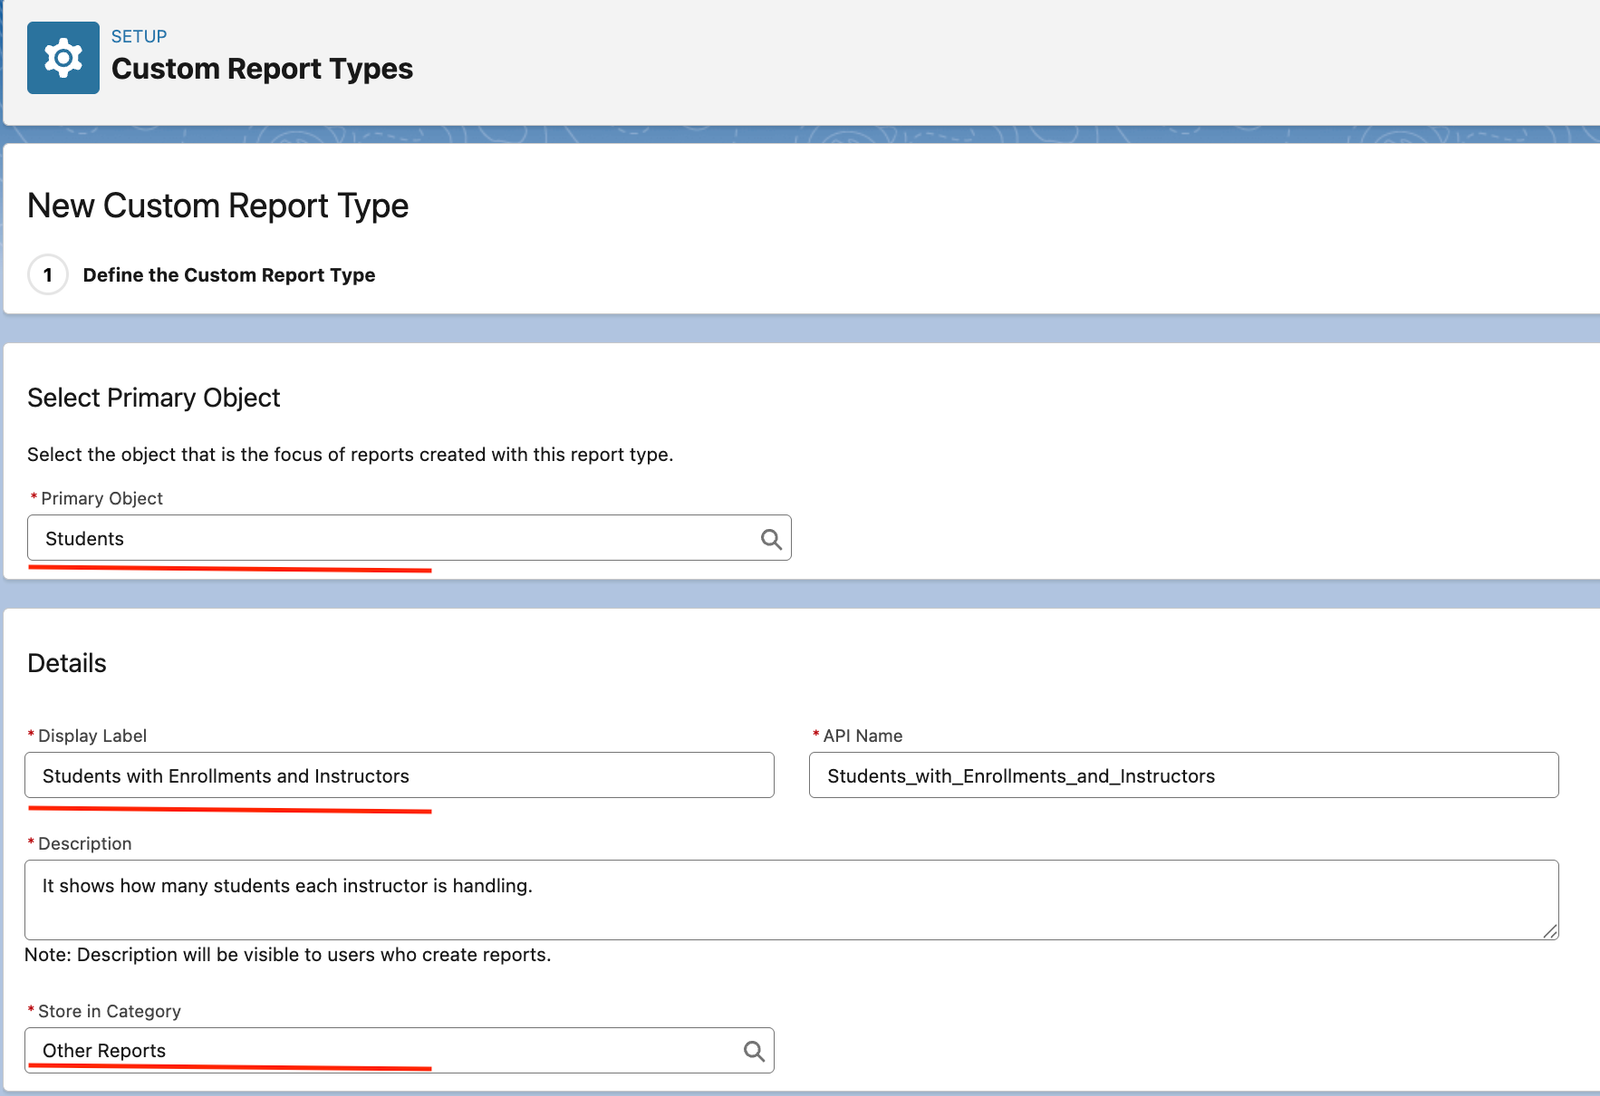
- Click New Custom Report Type
- Choose the primary object as Student
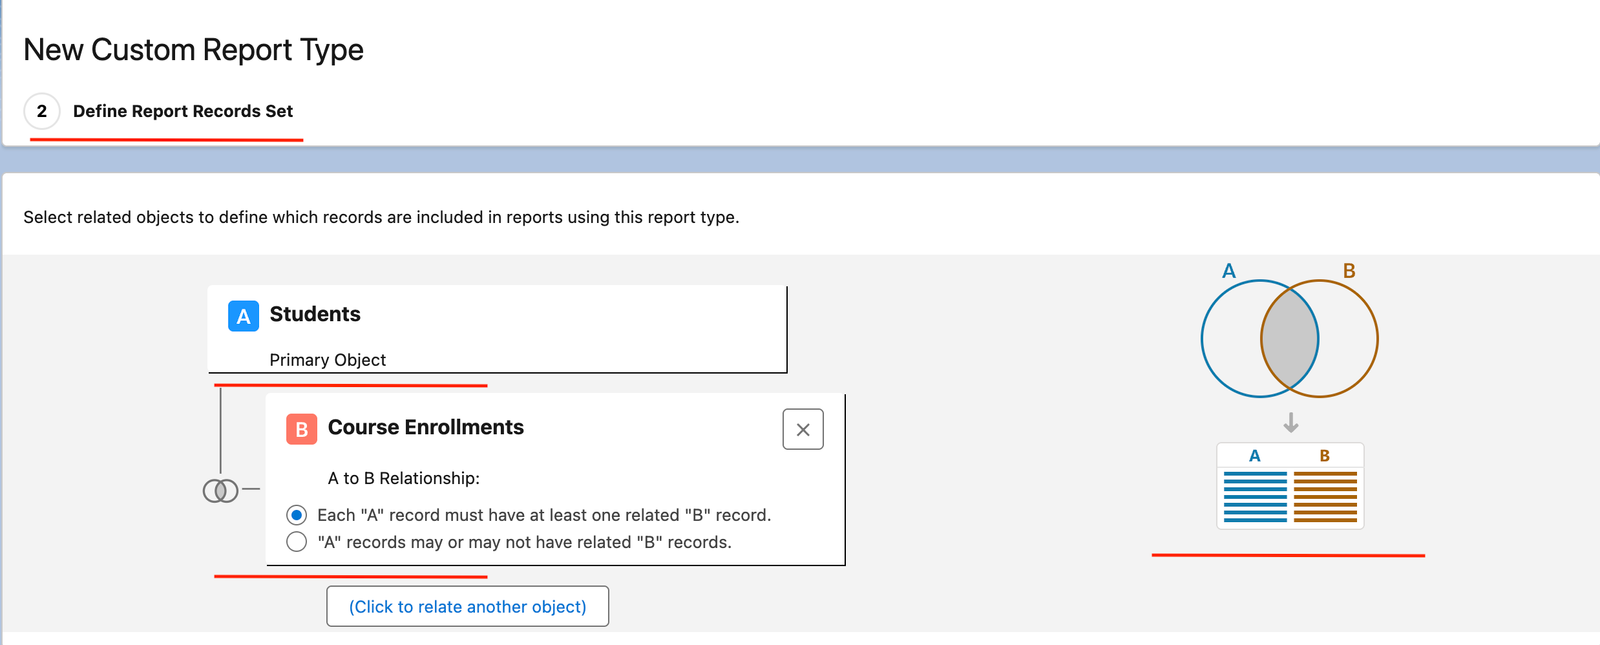
- Add Course Enrollment as the related object
- Name your report type (e.g., “Students with Enrollments and Instructors”) and save
- Click Edit Layout to include fields like:
- Student Name, Email
- Enrollment Date
- Instructor Name, Email
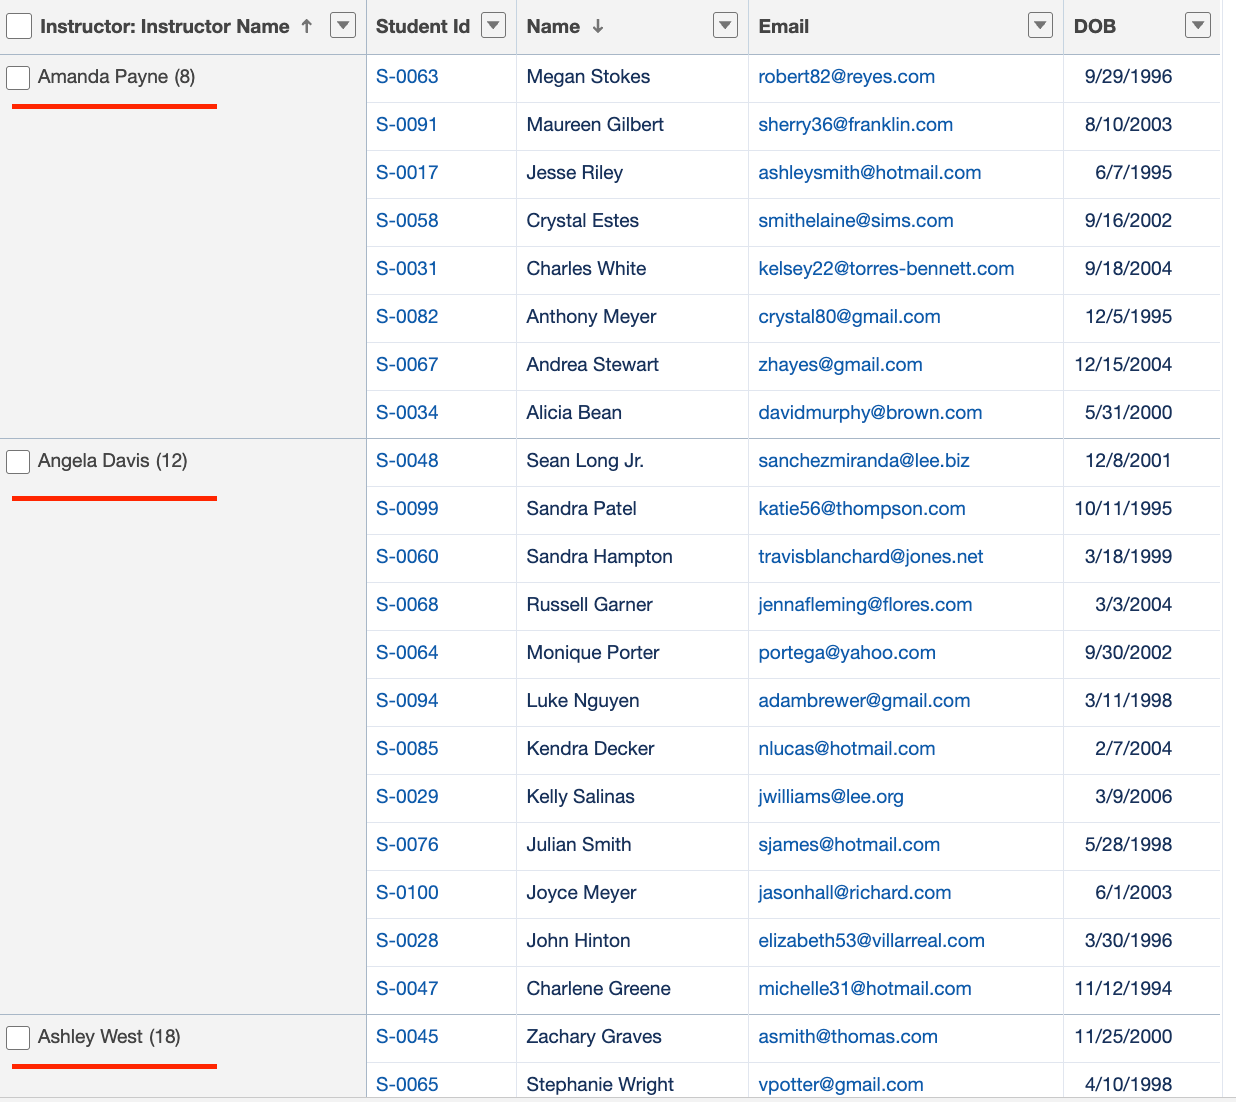
The report below shows the Instructor Workload Summary.
Features of Custom Report Type as Advanced Salesforce Report Features
- Connect Multiple Objects
You can include related objects like Students, Course Enrollments, and Instructors, even if the standard report types don’t support that combination. You can add up to 4 objects.
- Customise the Fields That Appear
As an Admin, you can choose which fields are available in the report builder for users to add.
- Include Lookup Fields from Related Objects
Fields from objects like Instructor (linked via Course Enrollment) can be pulled into the report.
2. Joined Reports
What are Joined Reports as an advanced Salesforce report feature?
A Joined Report lets you combine multiple views of your data into a single report, even if they come from different report types.
You can think of it like laying out two or more reports side-by-side, where each one has its own filters, fields, and groupings, but all share the same canvas with the same results.
Joined reports are helpful when:
- You want to compare different datasets in one place.
- You need to analyse trends across multiple objects.
- You want to avoid building and maintaining several separate reports.
Example with Steps to Create Joined Reports
Let’s say you want to understand how your Sales reps are performing (Opportunities) and how many cases are being raised by their closed-won customers.
So this is where the Joined Reports come into the picture, where instead of building two separate reports and switching tabs, you can create Joined Reports easily.
Steps: Create a Joined Report
- Start a New Report
- Go to Reports → click New Report
- Choose Opportunities as the base report type
- Click Continue
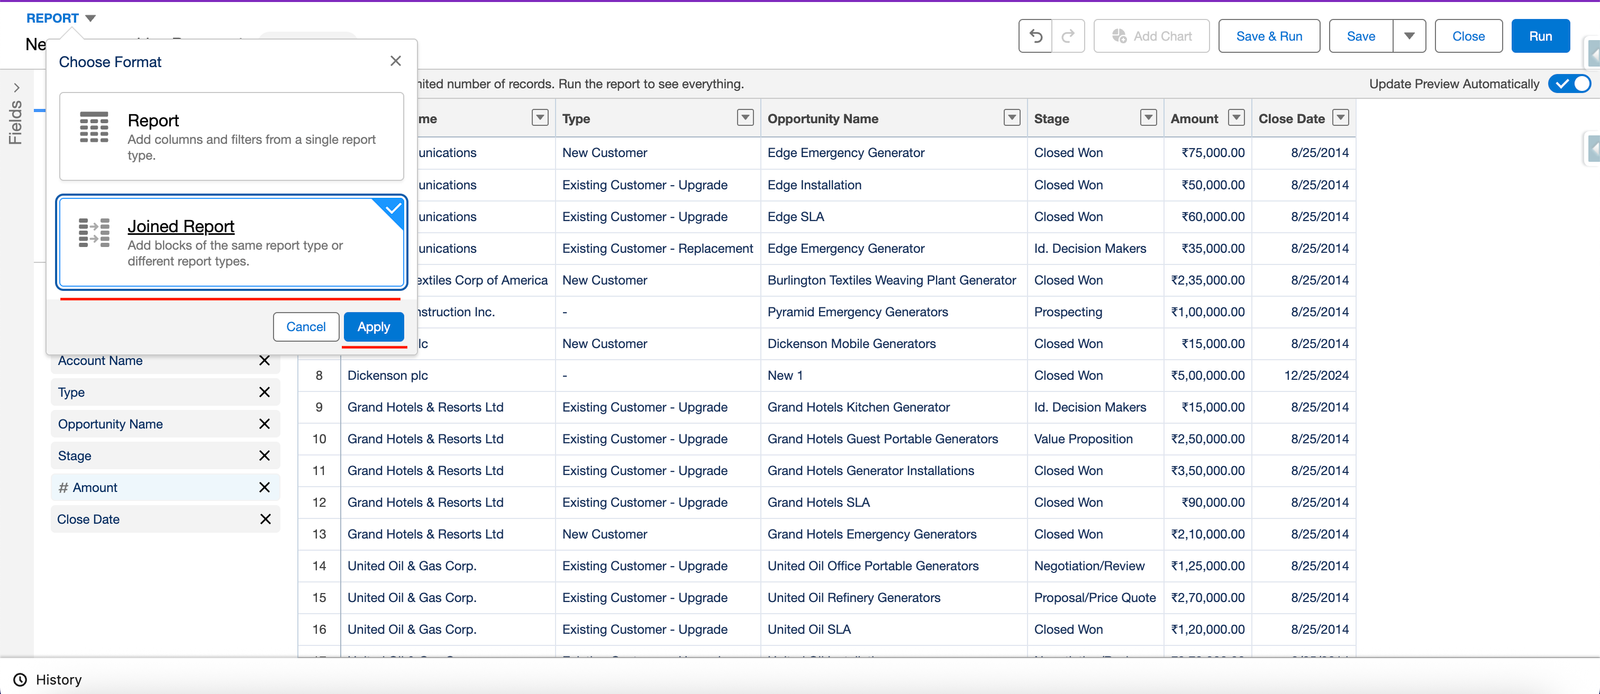
- Convert to a Joined Report
- Switch to Joined Report Format in the top-left corner, click the “Report Format” dropdown, and select “Joined Report”.
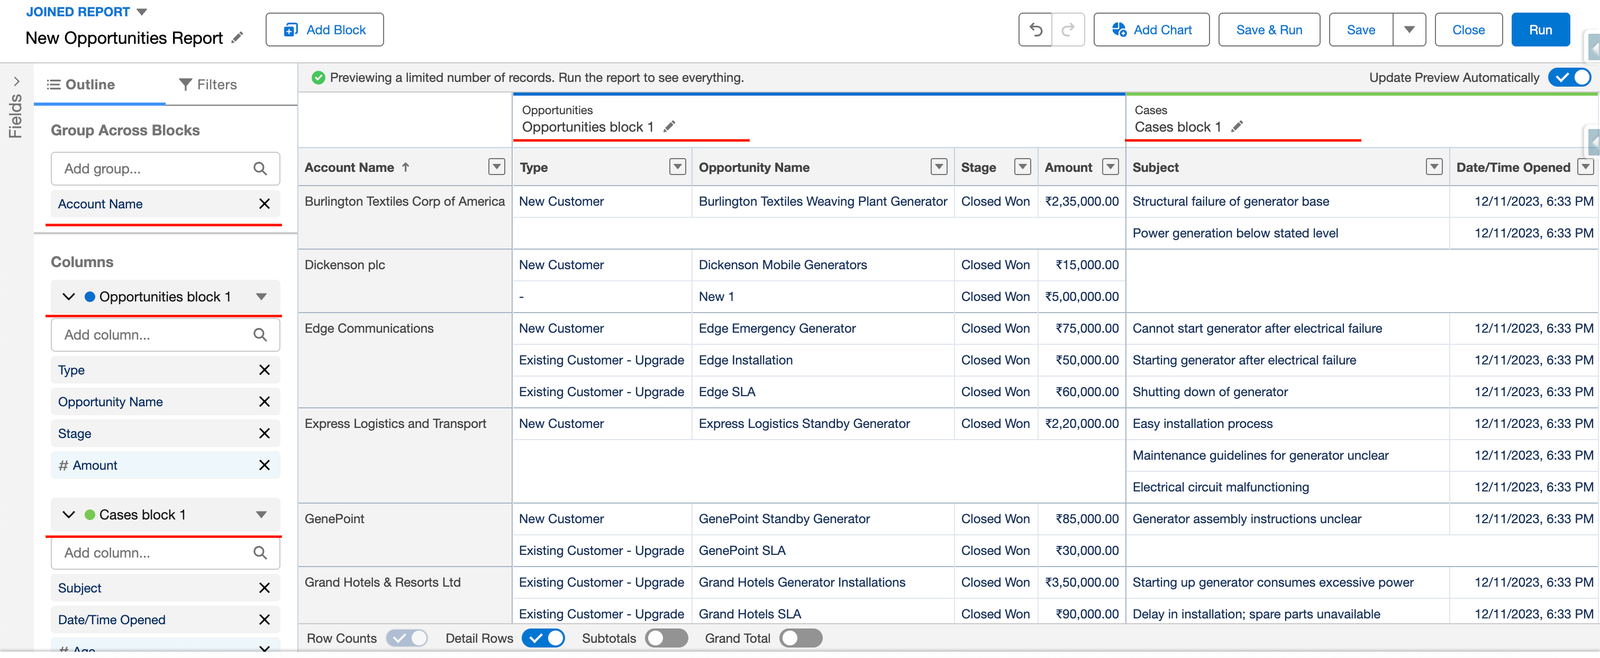
- Add Opportunity Block
- In the first block, keep the type as Opportunities and then add columns as Account Name, Opportunity Name, Stage, Amount, etc.
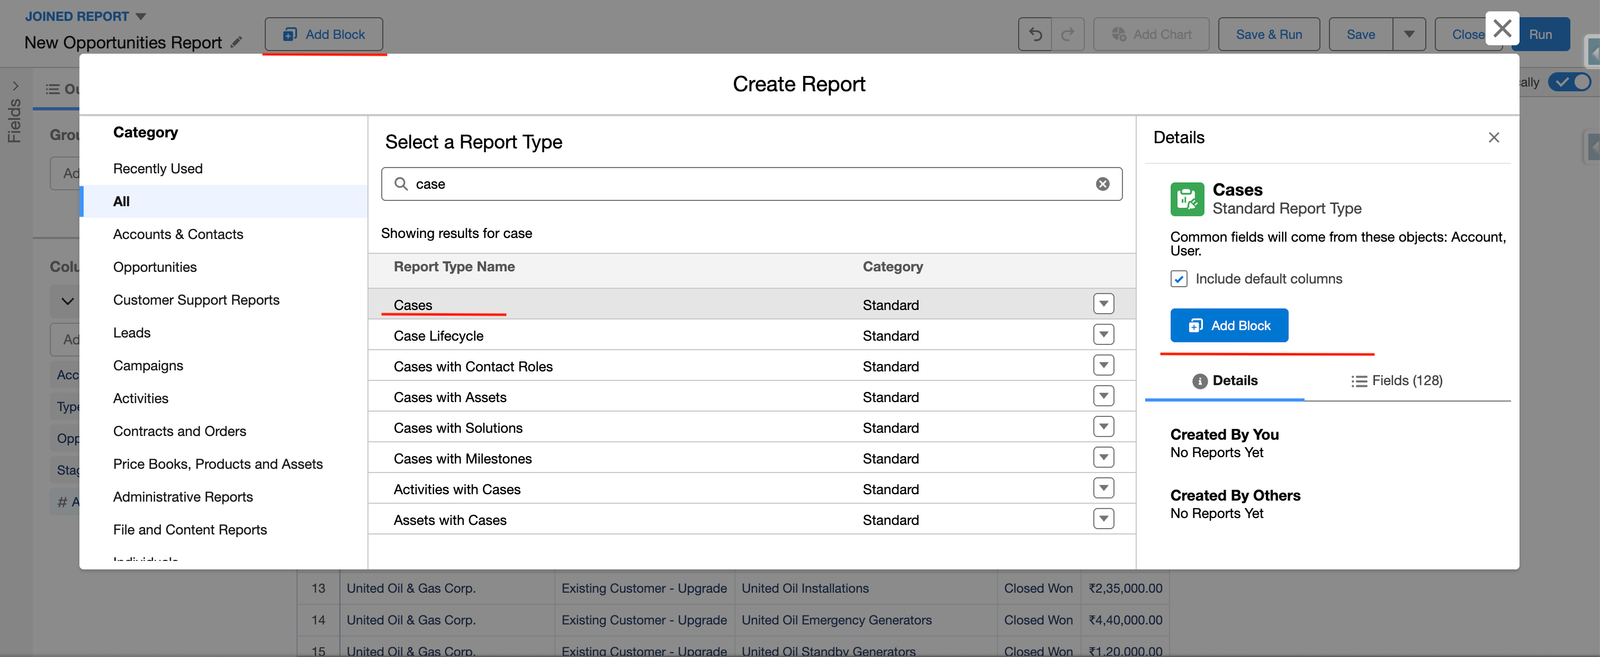
- Add Second Block – Cases
- Click Add Block
- Choose Cases as the report type and add columns as Account Name, Subject, Age, etc.
- Use Common Grouping
- First, align both blocks by Account, then you can group both blocks by Account Name.
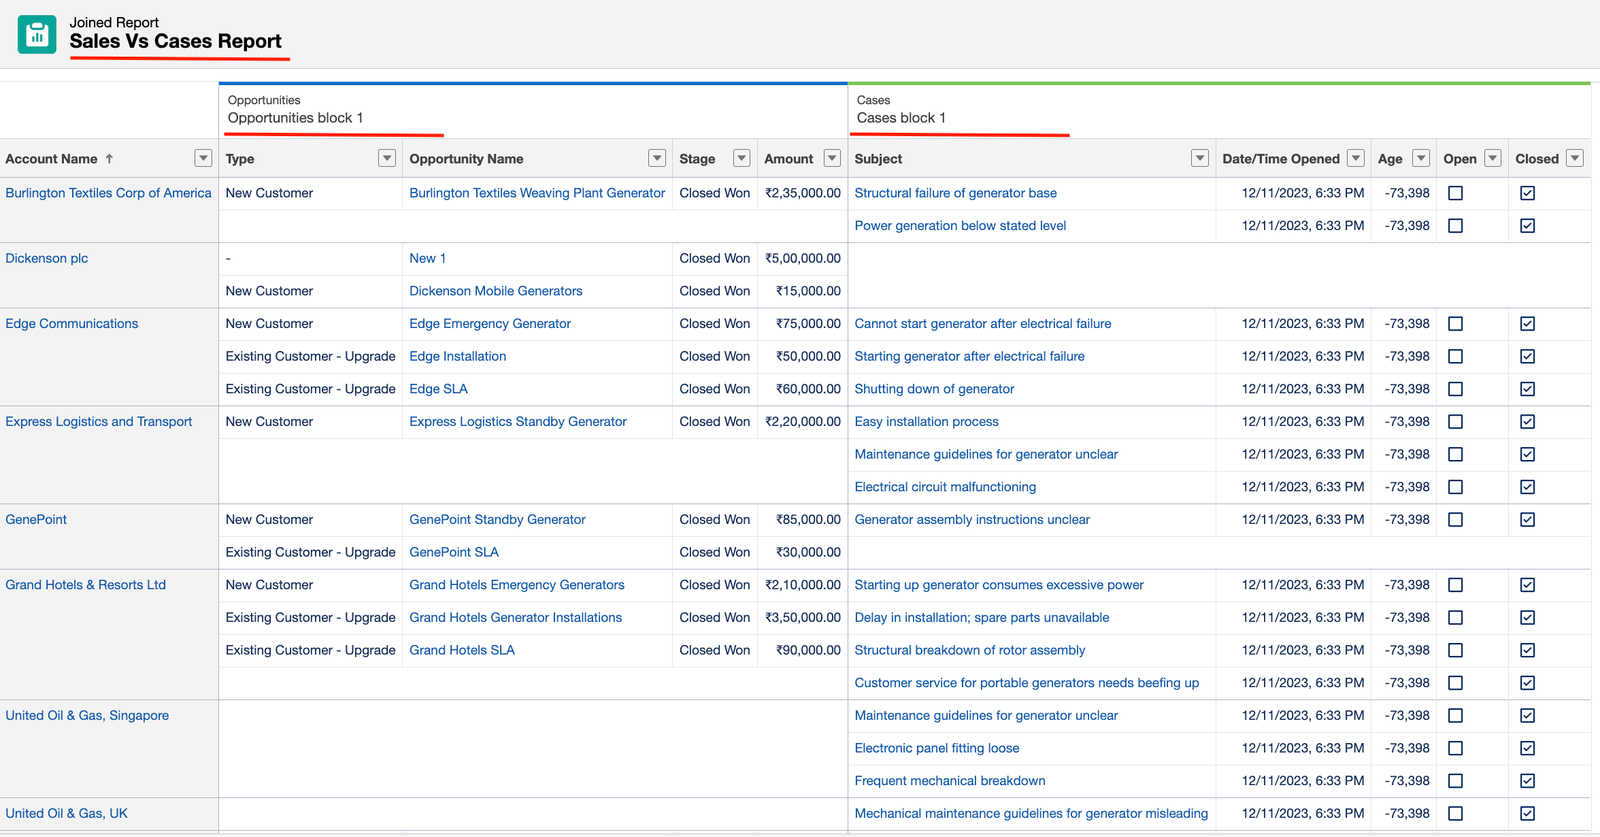
- Name the report something like “Sales vs. Cases Report” and save it.
Features of Joined Reports as an Advanced Salesforce Report Features
- Multiple Report Blocks
You can add up to 5 blocks in one joined report, each with its own report type.
- Independent Filters
Each block can have its filters, so you can compare different periods or datasets side by side.
- Shared Grouping
You can group data across all blocks by a common field for a better comparison.
- One Report, Many Views
No need to export multiple reports, everything shows up in a single, scrollable view.
3. Cross Filter in Advanced Salesforce Report Feature
What is Cross Filter?
Cross Filters let you filter records based on the presence or absence of related records. There is no need for formula fields, joins, or extra objects.
Sometimes the most important insights come from what’s not there, like Contacts who’ve never raised a support Case, or Accounts without any Opportunities. That’s exactly what Cross Filters help you uncover.
Example with Steps to Create a Cross Filter
Let’s say you want to identify all active Contacts who have never submitted a Case so that they can check in or invite them to a help webinar.
Steps: Create a Cross Filter
- Create a New Report
- Go to Reports → click New Report and select Report Type: Contacts & Accounts.
- Click Continue
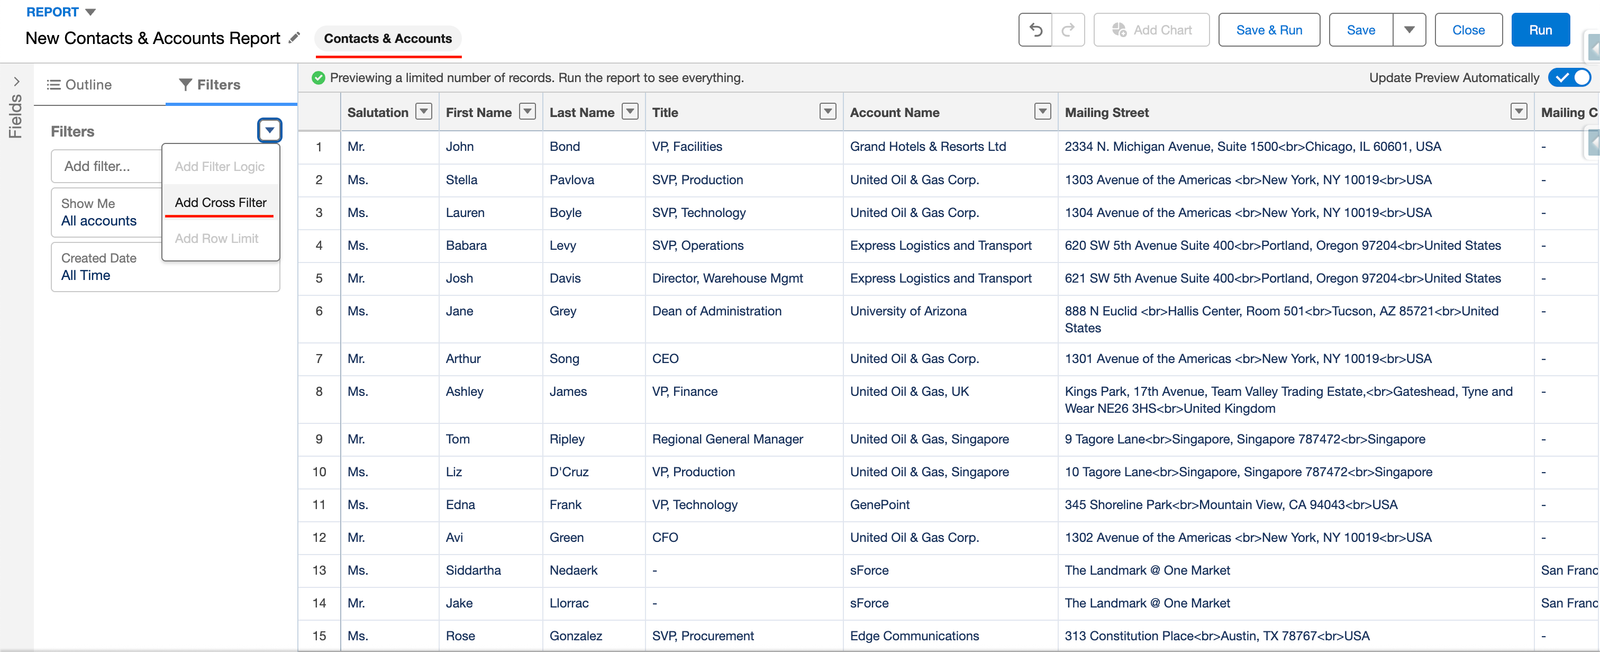
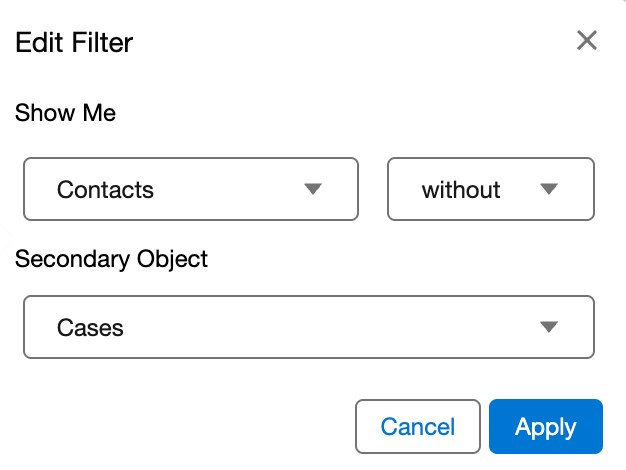
- Add a Cross Filter
- Go to Filters → click “Add Cross Filter”
- Set it to – “Contacts → without → Cases”
- This will filter out any contacts that have ever raised a Case
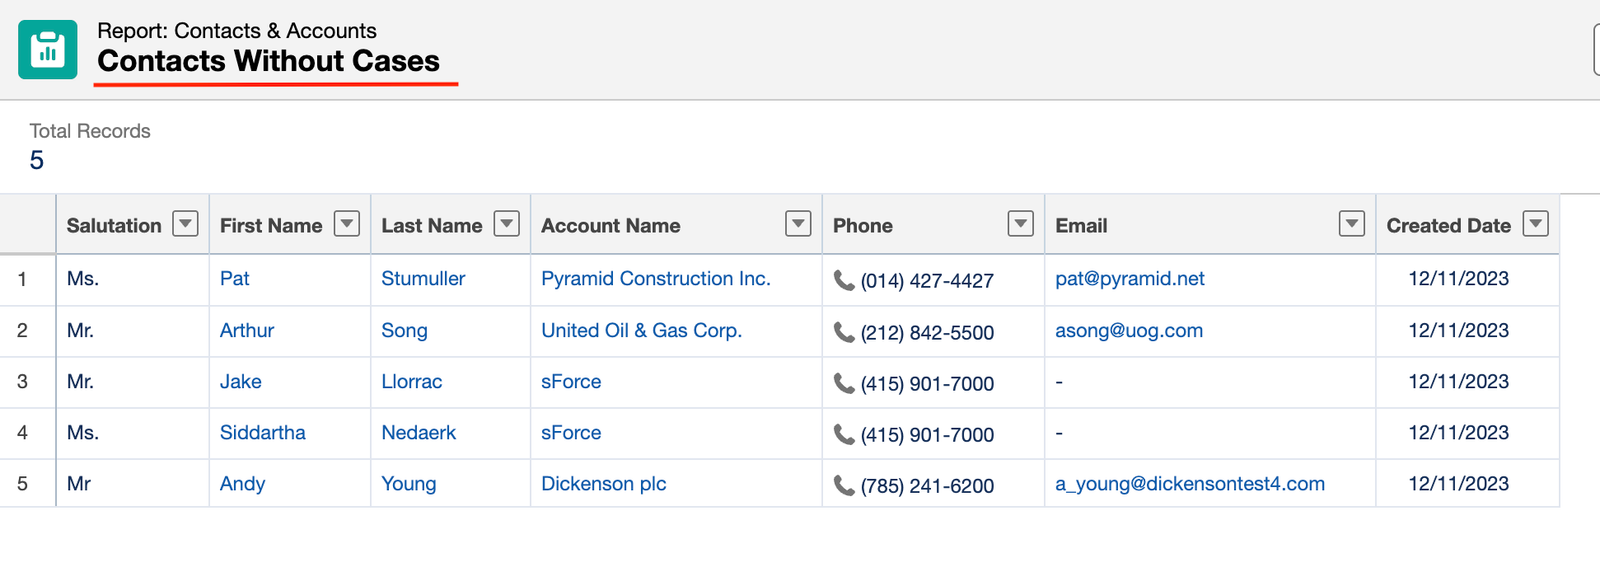
- Name it something like Contacts Without Support Cases and save it.
Features of Cross Filter as an Advanced Salesforce Report Features
- Filter by Related RecordsYou can include or exclude records based on whether they have related records.
- “With” or “Without” LogicYou can filter using “with” (must have related records) or “without” (no related records). Helps find both active and neglected data points.
4. Advanced Salesforce Report Feature: Row-Level Formulas
What is a Row-level Formula?
A Row-Level Formula lets you add a custom calculated column in your report based on other fields in each row. It works only inside the report and doesn’t change your actual Salesforce data. This will help you when the report needs a calculation that doesn’t exist as a field on the object, like how long a case has been open, or what percent of a deal has been discounted, etc.
Example and Steps to Create Row-Level Formula
Let’s say you want to track how long support cases have been open, directly in the report without editing the Case object.
Steps: Create a Row-Level Formula
- Create a New Report
- Go to Reports → click New Report and select Report Type: Cases
- Select the filter as Open Cases
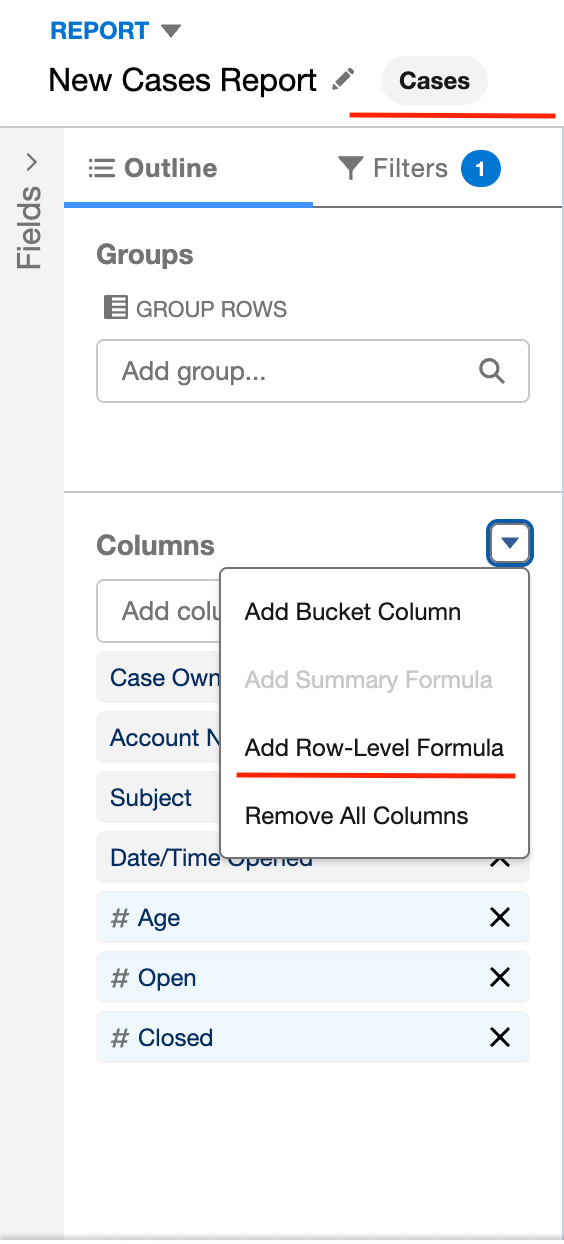
- Click “Add Row-Level Formula” found in the columns section (left side)
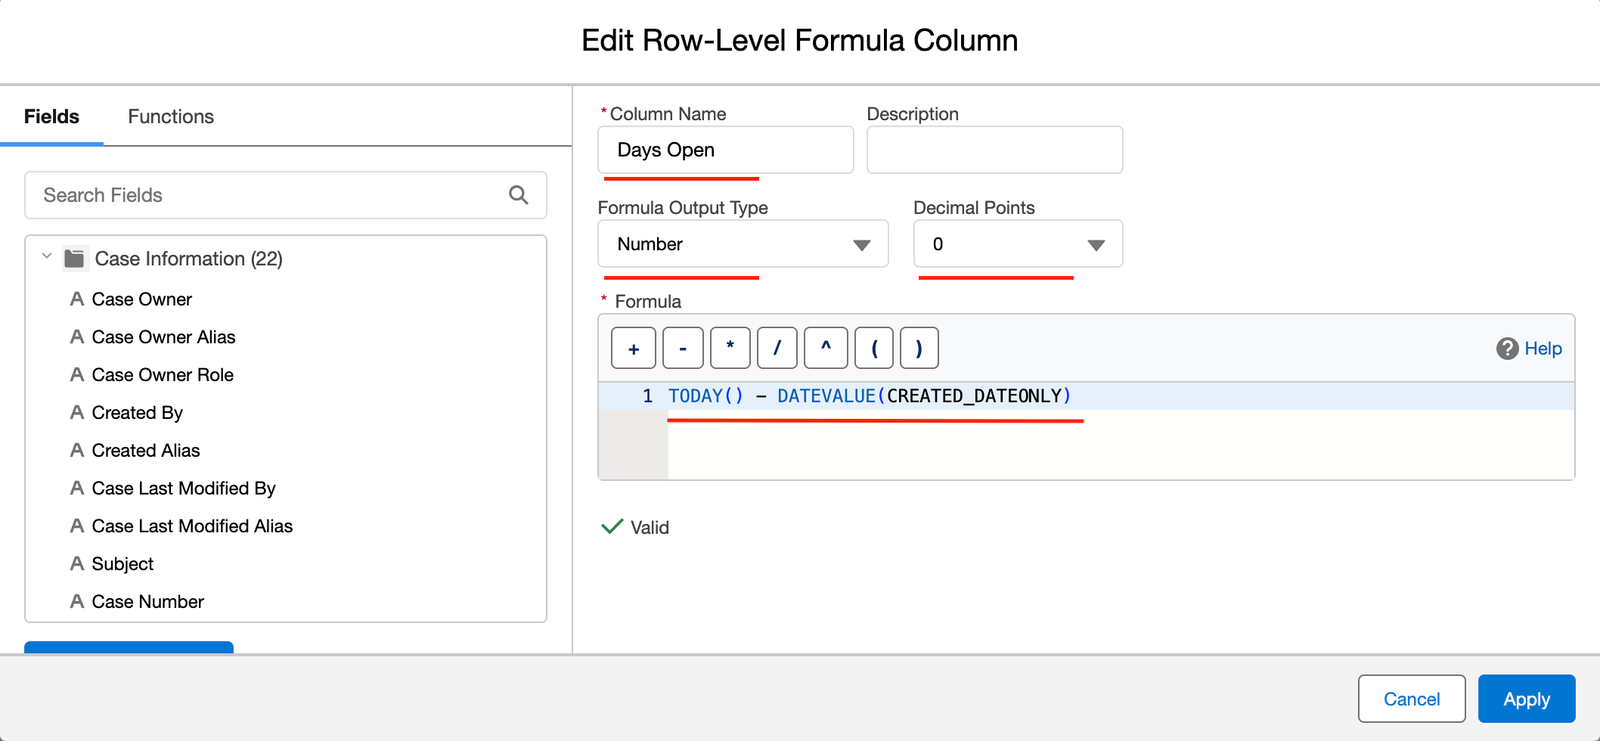
- Set Up the Formula
- Column Name: Days Open
- Formula:
TODAY() - DATEVALUE(CreatedDate) - Data Type: Number
- Decimal Places: 0
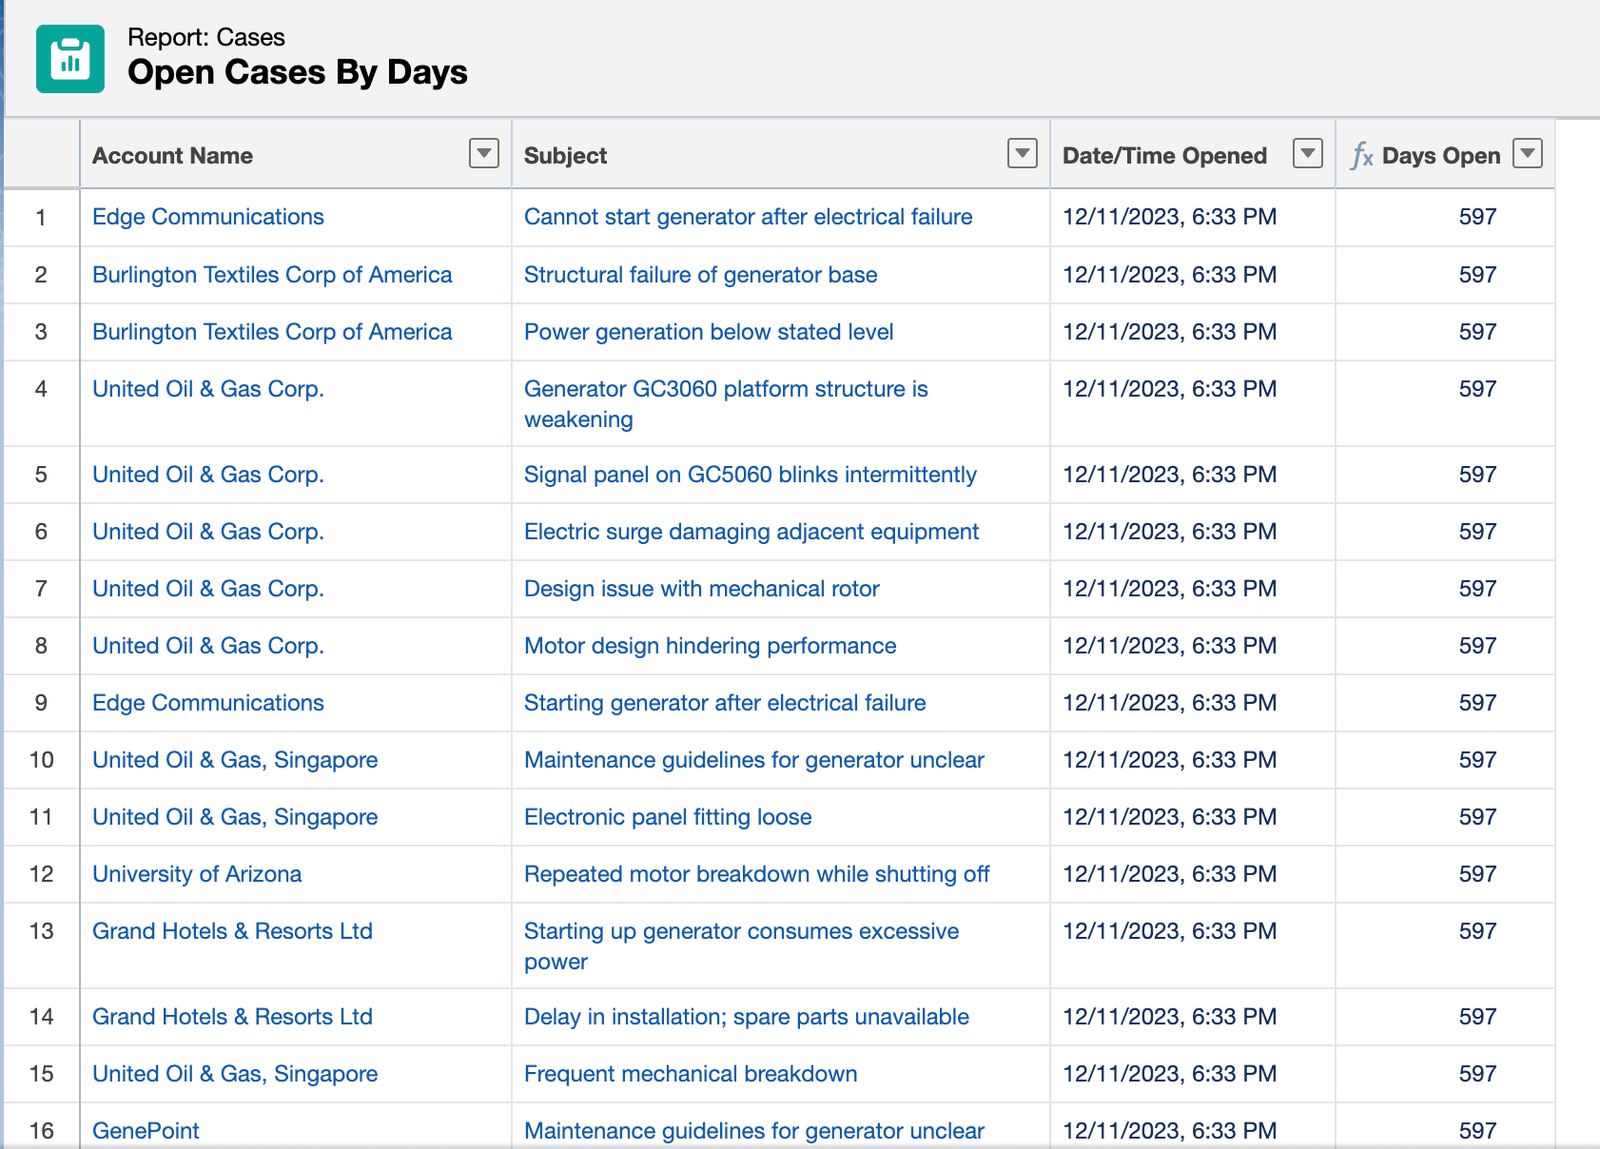
- Click Apply, and you’ll see a new column that calculates the number of days each Case has been open.
Features of Row-Level Formula as an Advanced Salesforce Report Feature
1. Live Calculations in Reports
- Calculate values like age, duration, discounts, or scores on the fly
2. No Object-Level Changes Needed
- No need to clutter your object with extra formula fields
3. Supports Math, Logic & Text Functions
- You can use all the Math and Logic building functions
5. Historical Trend Reporting in the Advanced Salesforce Report Feature
What is Historical Trend Reporting?
Historical Trend Reporting lets you track how values in your data have changed over time by comparing current values to snapshots Salesforce stores in the background. It shows what changed in the data since last week, or who moved deals into the pipeline, or how your forecast evolved.
This is available for Opportunity, Case, and up to 3 Custom Objects, where most of the fields are pre-selected, and you can choose more.
Example and Steps to Set Up Historical Trend
Let’s say you want to compare your Opportunity pipeline this week vs last week, to see what’s been added, lost, or pushed.
So, Historical Trend Reporting can show Changes in Amount, Stage, and Close Date, and which records are new, removed, or modified.
Steps: Set up Historical Trend
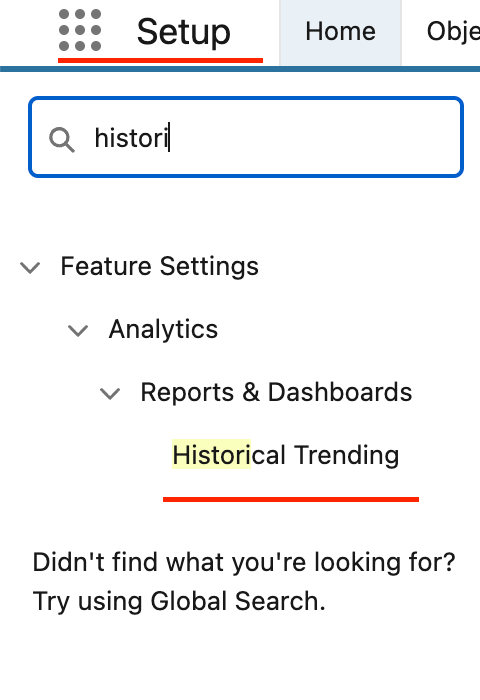
- Enable Historical Trending
- Go to Setup → Search “Historical Trending”
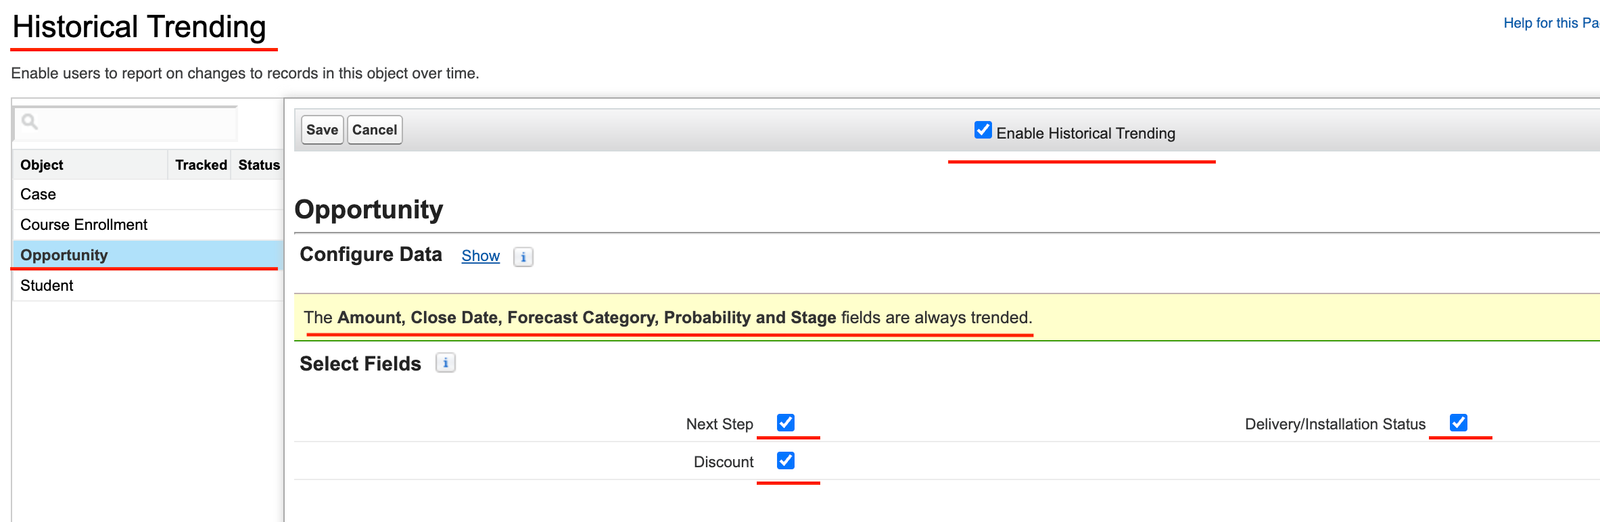
- Select the object Opportunity
- Choose up to 8 fields to track (like Stage, Amount, Close Date)
- Save
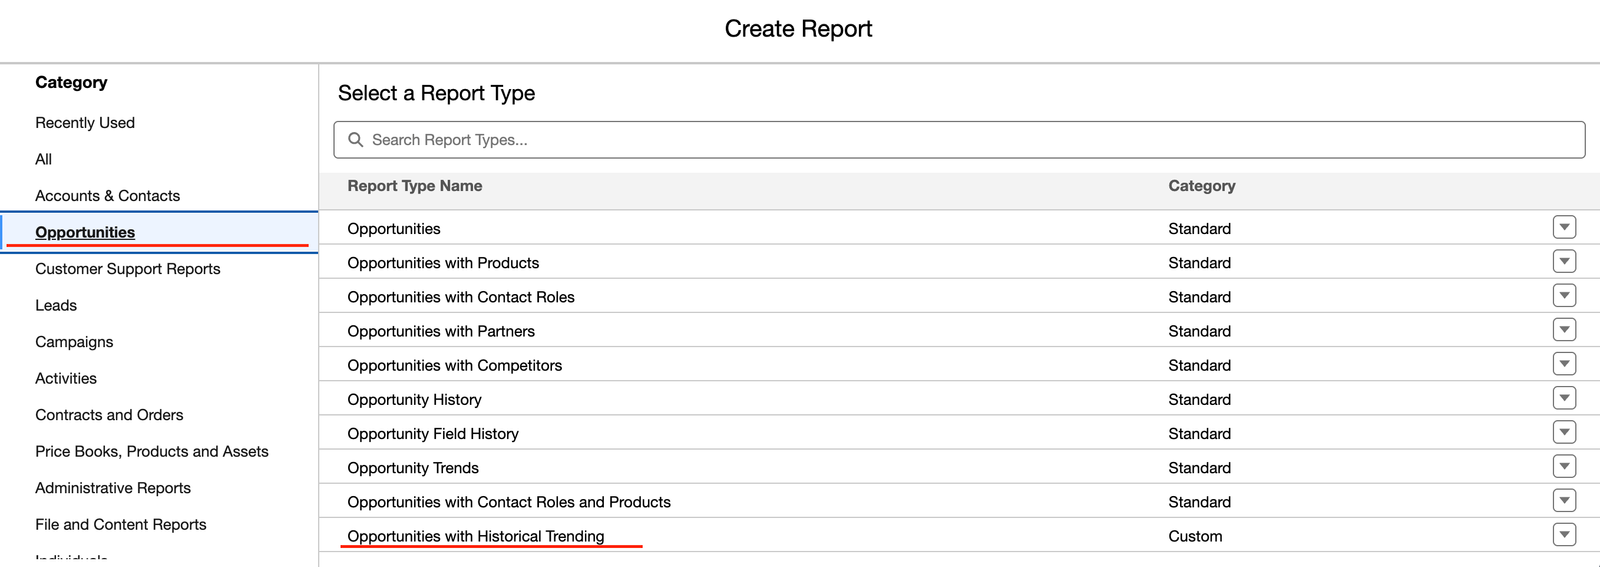
- Create a New Report
- Report Type: Opportunities with Historical Trending
- Add standard filters (such as Close Date = Current Fiscal Quarter)
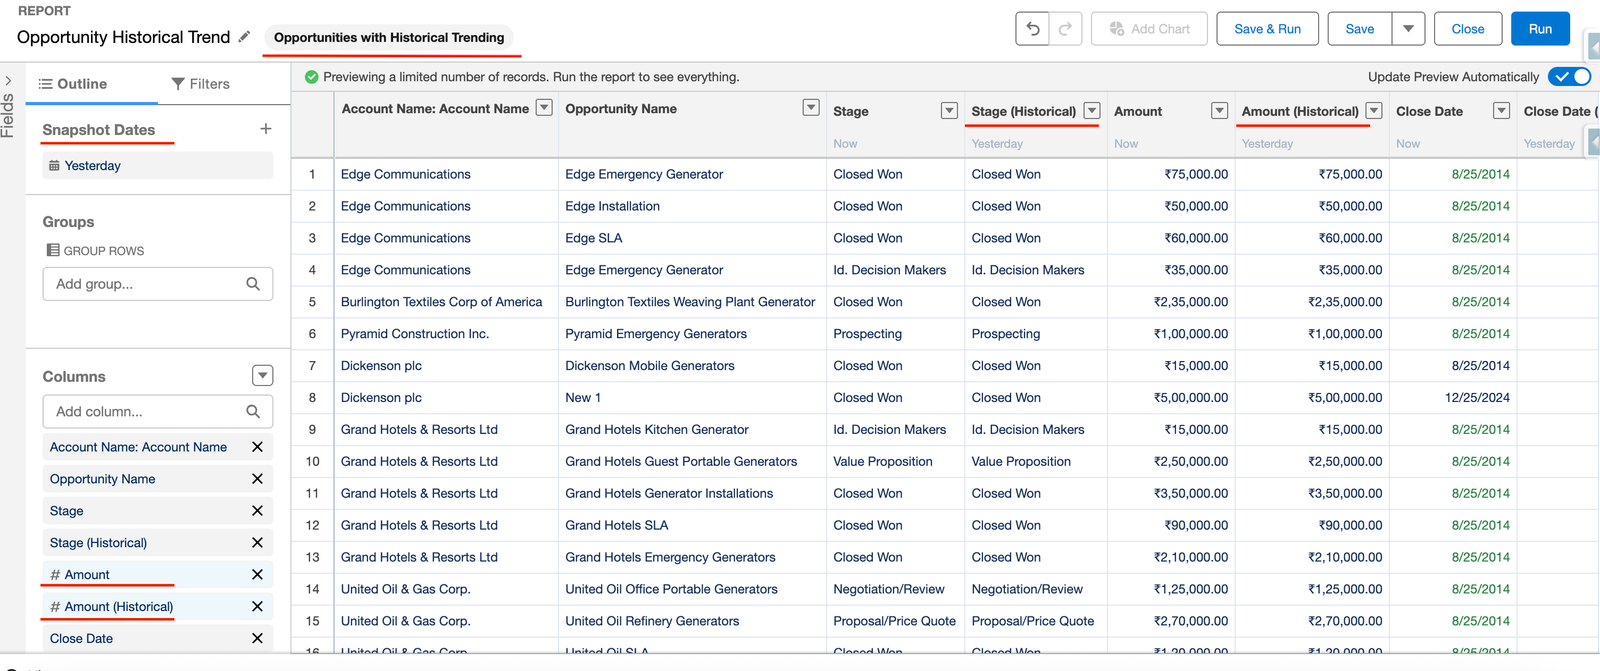
- Add Trend Fields like Amount, Amount – Historical Amount, etc.
- Use Historical Date Field
- Group by the Snapshot Date
- Compare changes between different time points (e.g., “7 days ago” vs. today.
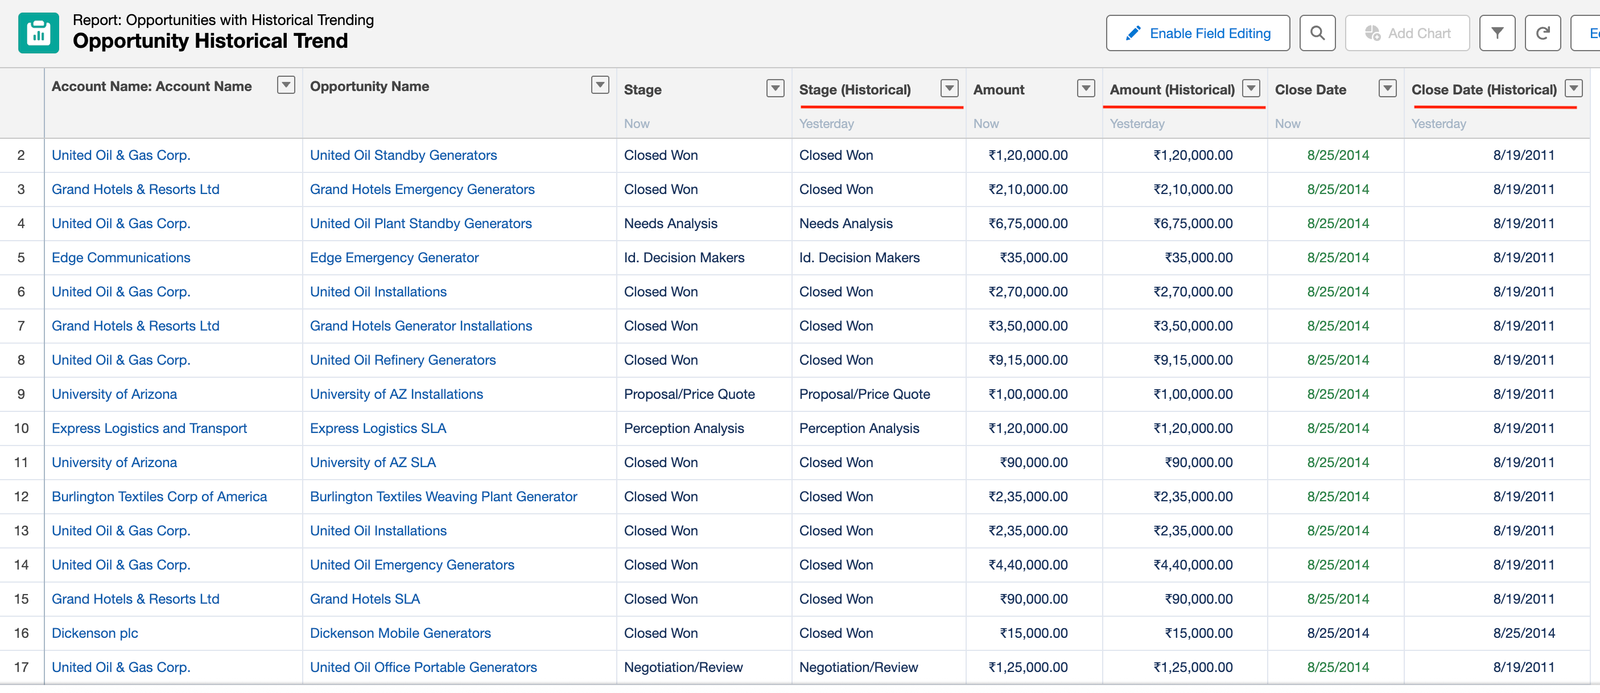
Features of Historical Trend as an Advanced Salesforce Report Features
- It tracks inserted, updated, and removed records
- It includes the snapshot date for comparison
- It works for standard and some up to three custom objects
- It supports formulas and charts
6. Summary Formulas
What are Summary Formulas as an Advanced Salesforce Report Feature?
A Summary Formula calculates values at the group level or report total level, not row by row. It works with numeric data like revenue, case count, or percentages, and is ideal for adding:
- Win rates
- Average resolution times
- Total discount percentages
- Conversion ratios, etc
Example and Steps to Add Summary Formulas
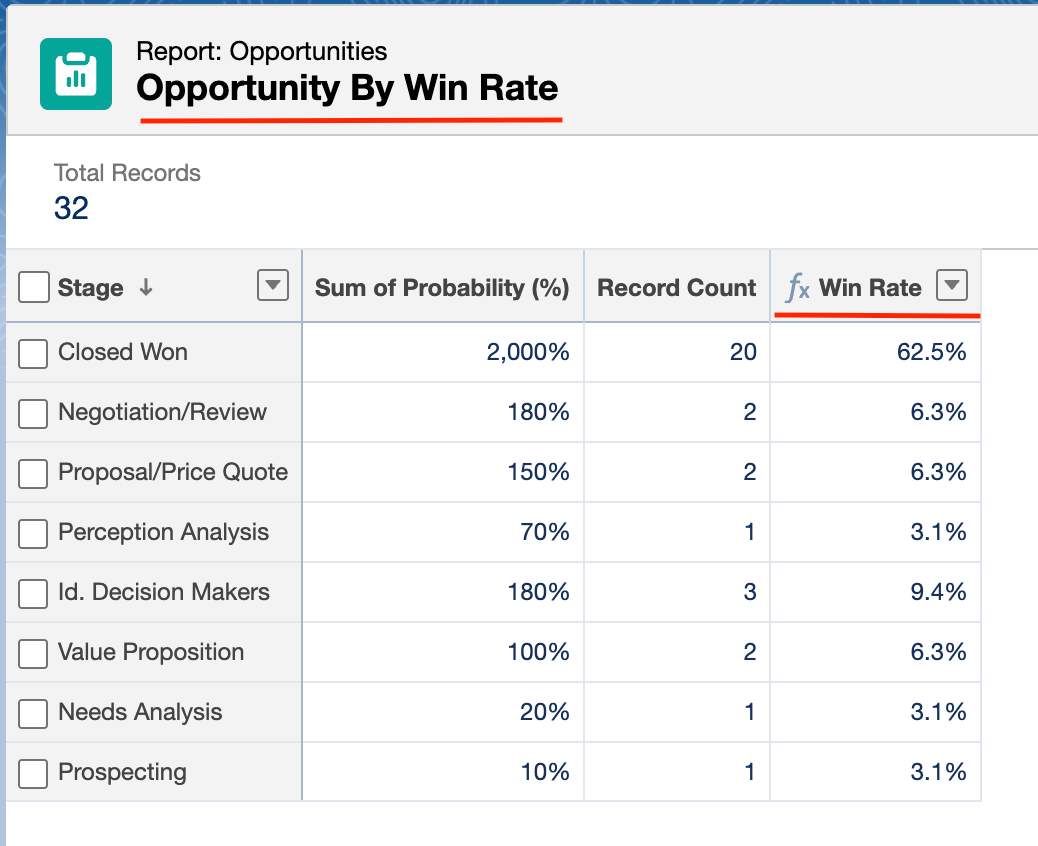
Let’s say you want to see the Opportunity Win Rate based on each stage vs. Total deals in their pipeline. So, we can add Win Rate as a Summary Formula, which represents how often your opportunities are successfully closed (Closed Won) out of the total opportunities being worked on.
Steps: Add Summary Formula
1. Create a New Report
- Report type: Opportunities
- Add filters based on closed date and click Continue
2. Group by Opportunity Stage to see opportunities group-wise.
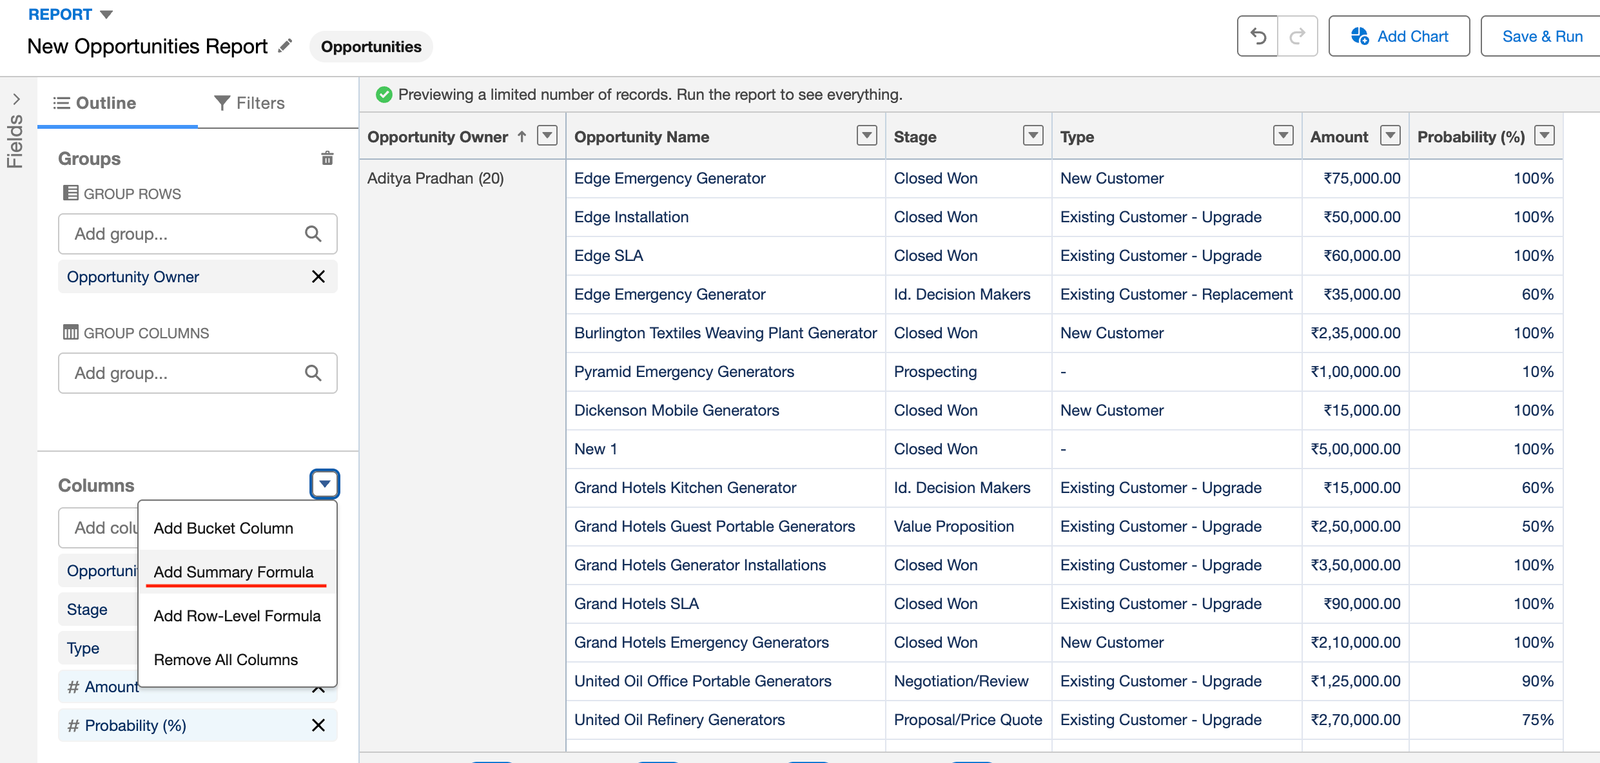
3. Add a Summary Formula
- Click “Add Summary Formula” found in the columns section (left side)
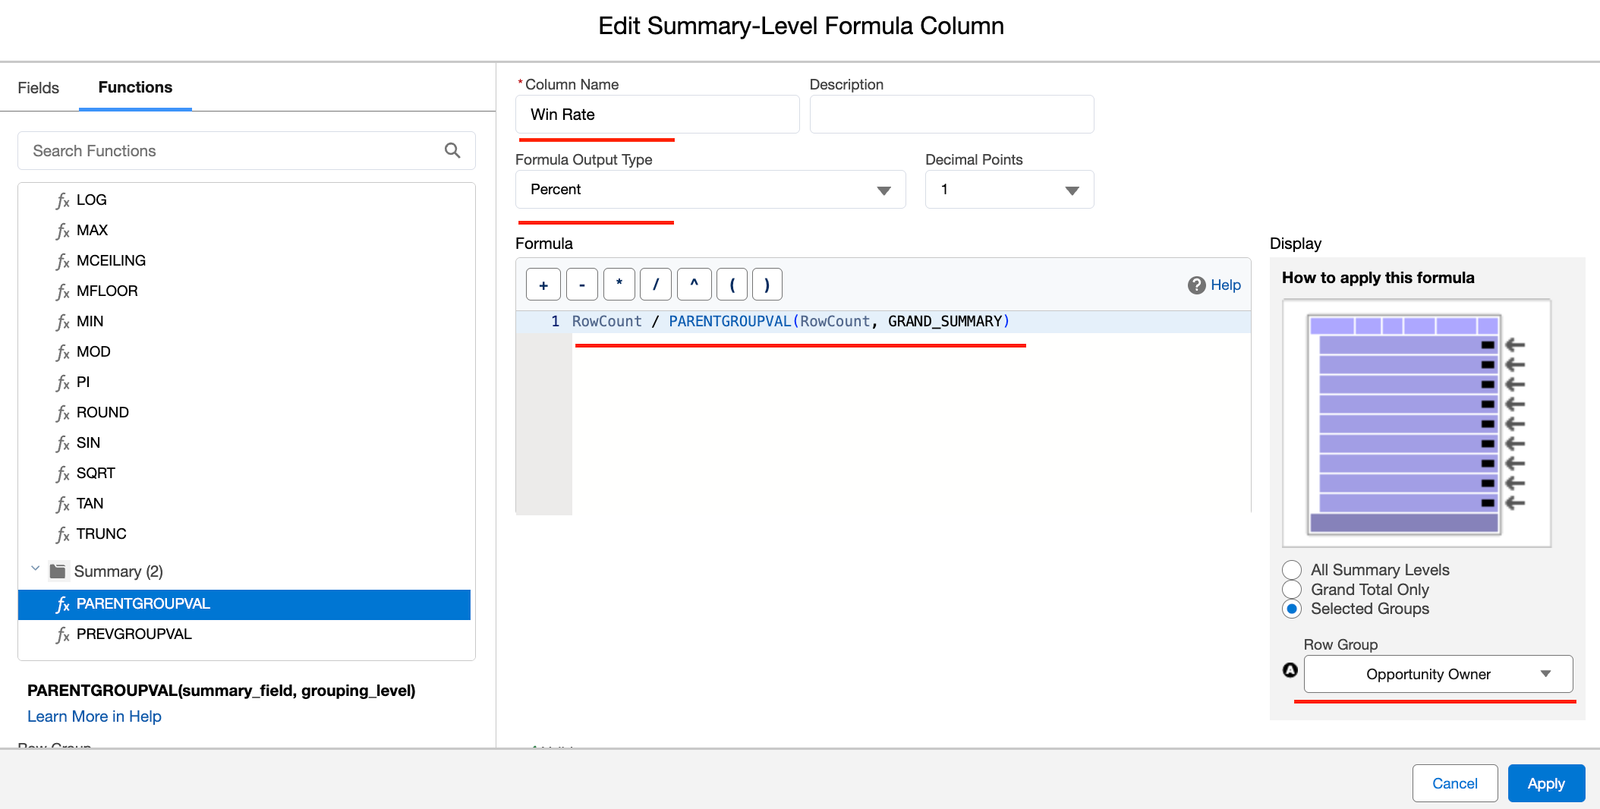
4. Setup Formula
- Column Name: Win Rate
- Formula:
RowCount / PARENTGROUPVAL(RowCount, GRAND_SUMMARY) - Display**:** At Group Level (Opportunity Stage)
- Click Apply.
A new column (Win Rate) will be added, with the percentage showing opportunities successfully closed.
Features of the Summary Formula as Advanced Salesforce Report Features
- Dynamic, On-the-Fly Calculations
Instantly compute values like win rate, average deal size, etc, directly in the report, and no need to create formula fields on objects.
- Grouped Data Calculations
You can apply formulas at different group levels (e.g., by Stage, Owner, Region).
- Multiple Summary Formulas per Report
You can create multiple formulas within the same report
- Works with Joined Reports
Summary formulas can be created within blocks in joined reports
7. Reporting Snapshots
What is Reporting Snapshot?
Reporting Snapshots allow you to capture and store report data, so that you can track changes over time. You can think of it like taking a scheduled “photo” of a report every day, week, or month, and saving that data in a custom object. You can then report on how metrics are trending over time.
Example and Steps to Set Up Reporting Snapshot
For instance, you want to track how the opportunity pipeline is changing week by week, and you want to know how many opportunities were in each stage at the start of each week.
So, by using Reporting Snapshots, you can make this possible even though Salesforce doesn’t store historical report data by default.
Steps: Set up Reporting Snapshots
1. Create a Custom Object
- Create Custom Object: Weekly Opportunity Snapshot
- Add custom fields to match the columns in your report:
- Opportunity Name
- Stage
- Amount
- Probability
- Snapshot Date ( Type date with Formula as Today())
2. Create a Source Report
- Go to Reports and create an Opportunity type report.
- Save it in a public folder.
3. Create a Reporting Snapshot
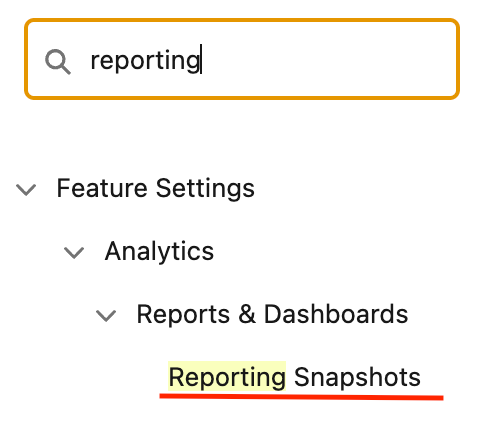
- Go to Setup > Reporting Snapshots
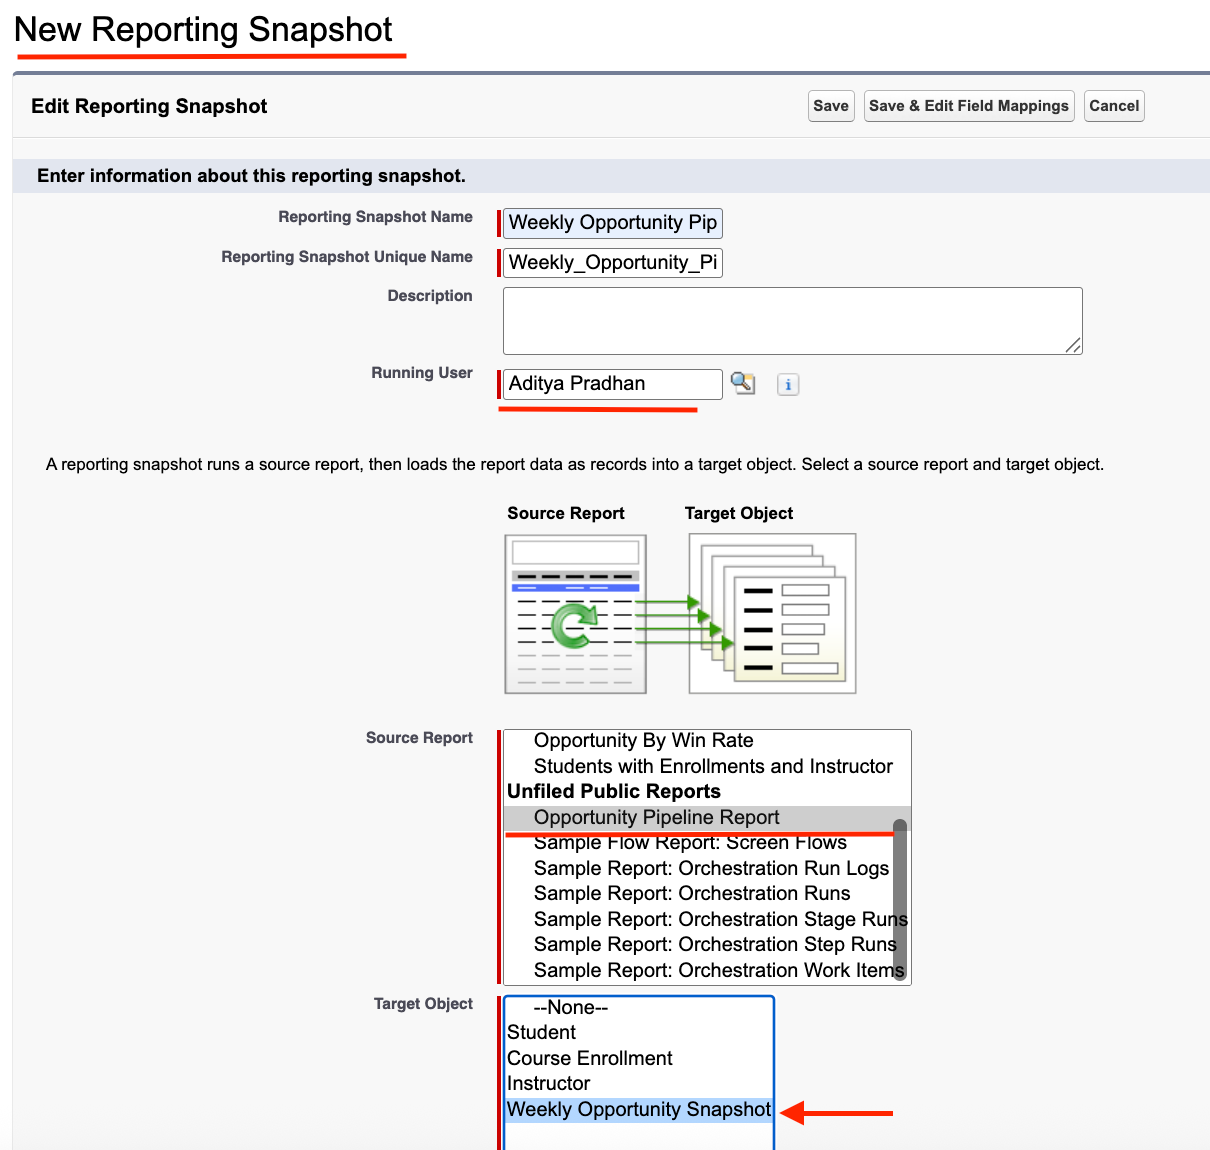
- Click New Reporting Snapshot
- Name: Weekly Opportunity Pipeline
- Running User: Choose someone with access to all records
- Source Report: Select the report from Step 2
- Target Object: Select the custom object from Step 1
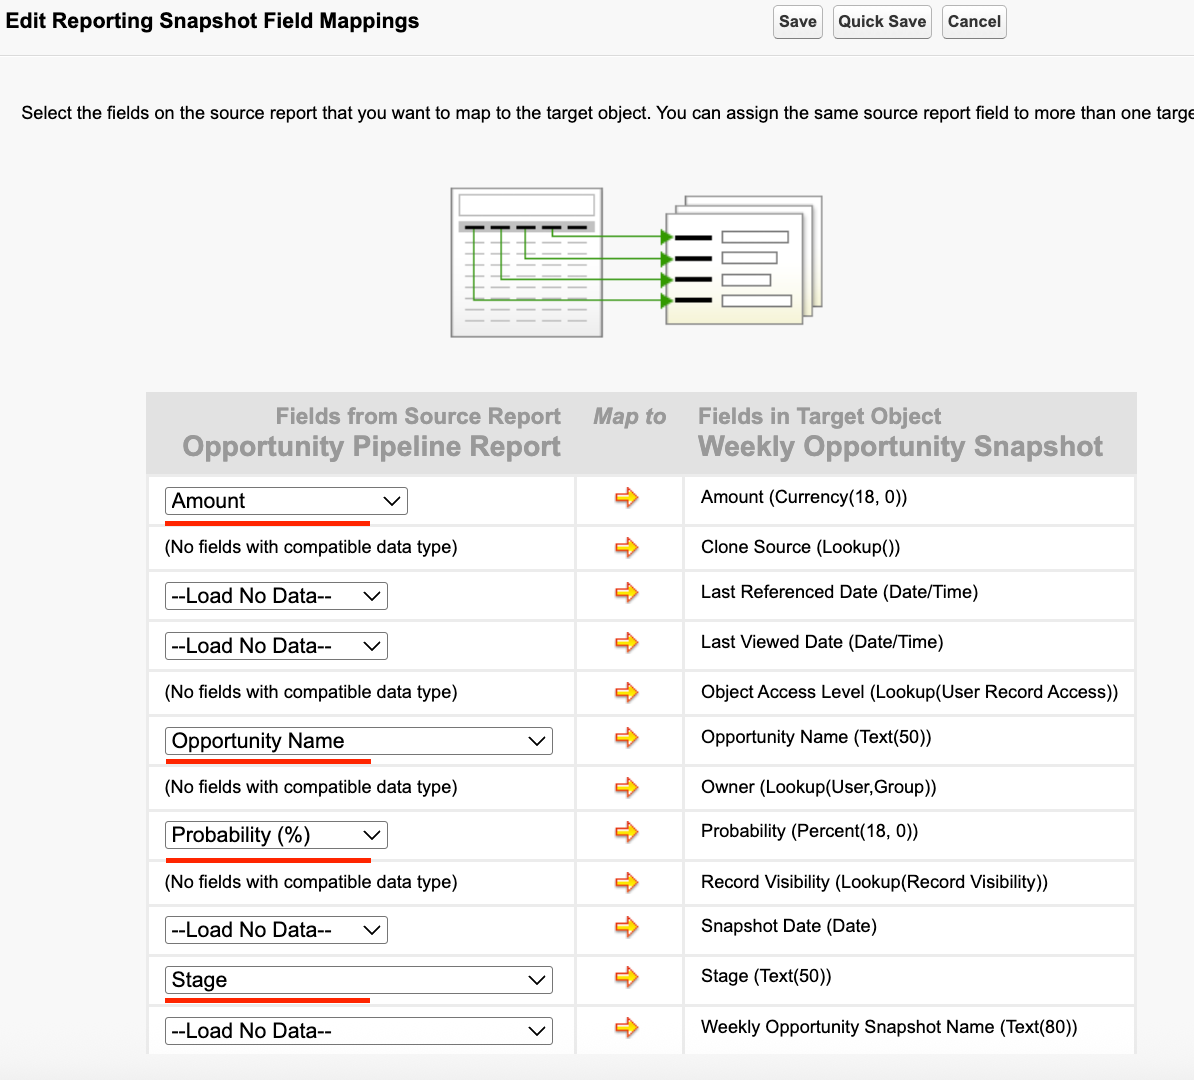
- Click Save & Edit Mapping
- Map each report column to the matching custom field in the object.
- Click Save.
You can schedule the job to run as per the requirement, and Salesforce will insert rows into your custom object with updated data every week, which you can use to generate a report for the weekly trend.
Features of Reporting Snapshot as an Advanced Salesforce Report Features
- Historical Data Tracking (Without Code): Reporting Snapshots let you track changes in report data over time, daily, weekly, or monthly
- Custom Object as Target: Snapshots push data into a custom object
- Field Mapping Control: You choose exactly which fields from the source report get saved to the target object
- Great for Trend Reports: Enables trend analysis dashboards, such as pipeline growth.
8. Field-to-Field Filtering
What is Field-to-Field Filtering?
Field-to-field filtering allows you to compare the values of two fields directly within a report. This is useful when you’re trying to identify inconsistencies, track data relationships, or enforce logical checks across rows.
This can be helpful where in Opportunities Close Date is before the Created Date (a data issue), or Tasks where the Due Date is after the Completed Date, or Cases where the Last Modified Date is after the Escalation Date.
Example and Steps to Add Field-to-Field Filtering
Let’s say you want to find records where the Opportunity Close Date is before the Opportunity Created Date, which usually signals a data entry mistake.
Steps: Add Field-to-Field Logic
- Go to Reports and click New Report
- Select “Opportunities” as your report type
- Click Continue
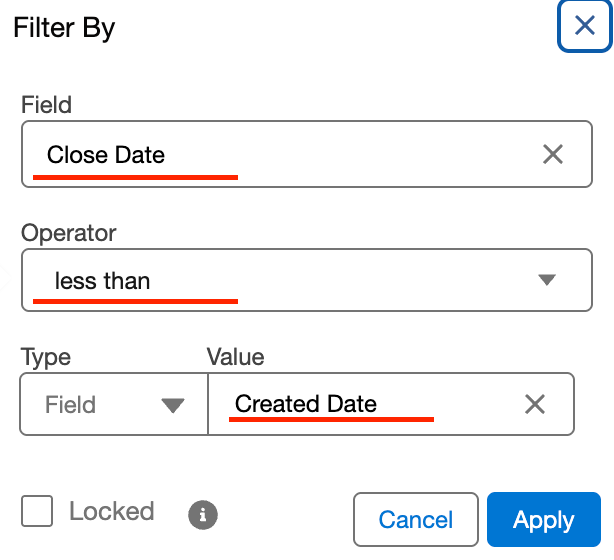
- In the Filters pane, search for the Close Date field
- Field 1: Close Date
- Operator: Less Than
- Field 2: Created Date
- Click Apply
Features of Field-to-Field Filters
- Compare two fields directly
- Works on date, number, and currency fields
- No custom formula fields needed
9. Bucket Fields
What is Bucket Field?
Bucket Fields let you group records into custom categories without creating a formula field or changing the object itself.
Instead of relying on standard field values like stages or ratings, you can “bucket” multiple values together. For example, grouping Opportunity Stages like “Prospecting”, “Qualification”, and “Needs Analysis” into a single bucket called “Early Stage”.
Example and Steps to Create a Bucket Field
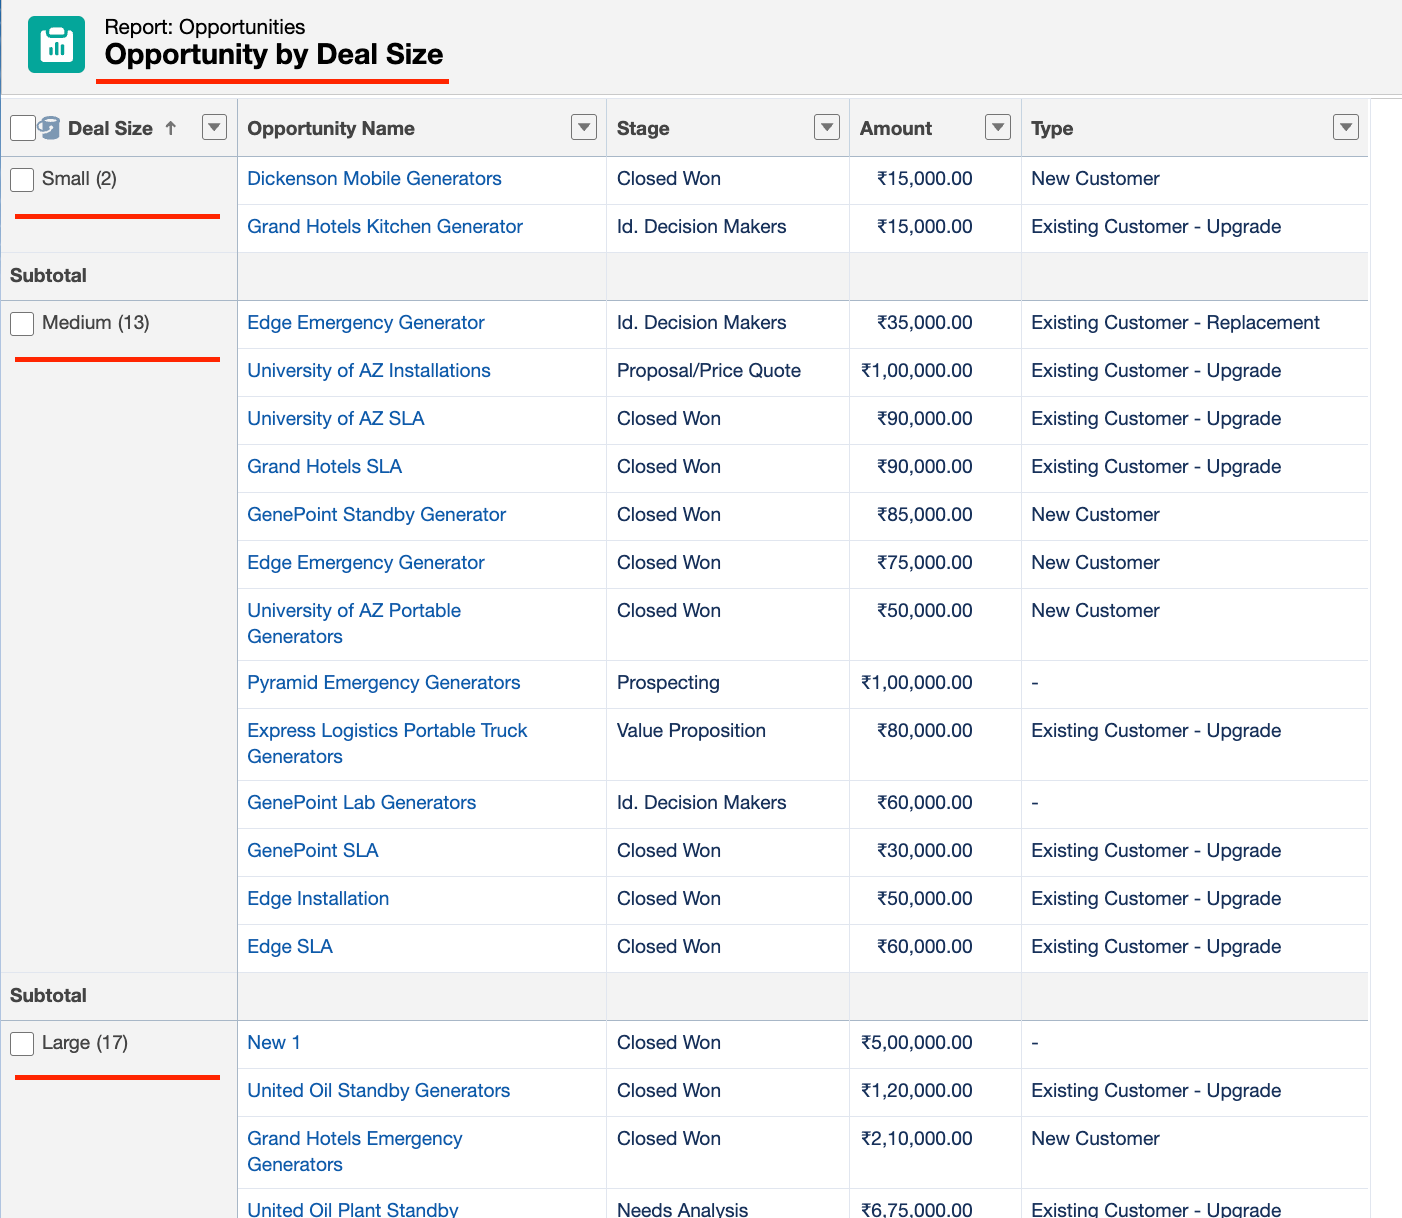
For instance, you want to group Opportunities by deal size, i.e.
- Deals under $25,000 → Small
- $25,000–$100,000 → Medium
- Above $100,000 → Large
Using a Bucket Field on Amount, you can display these groups in a chart or summary table, making trends easier to spot.
Steps: Create Bucket Field
- Go to Reports and create an Opportunity type report.
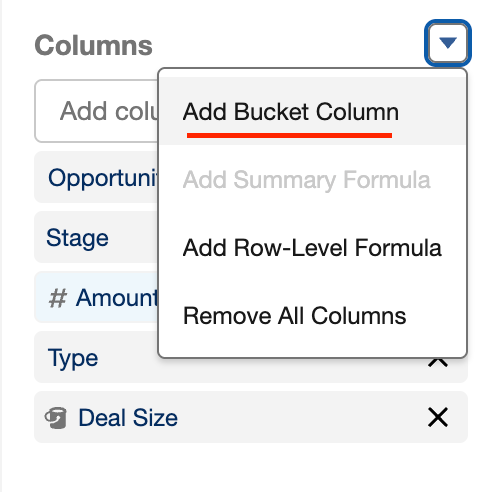
- Under the column section (left side), click ‘Add Bucket Column’
- Choose the field to bucket. Select
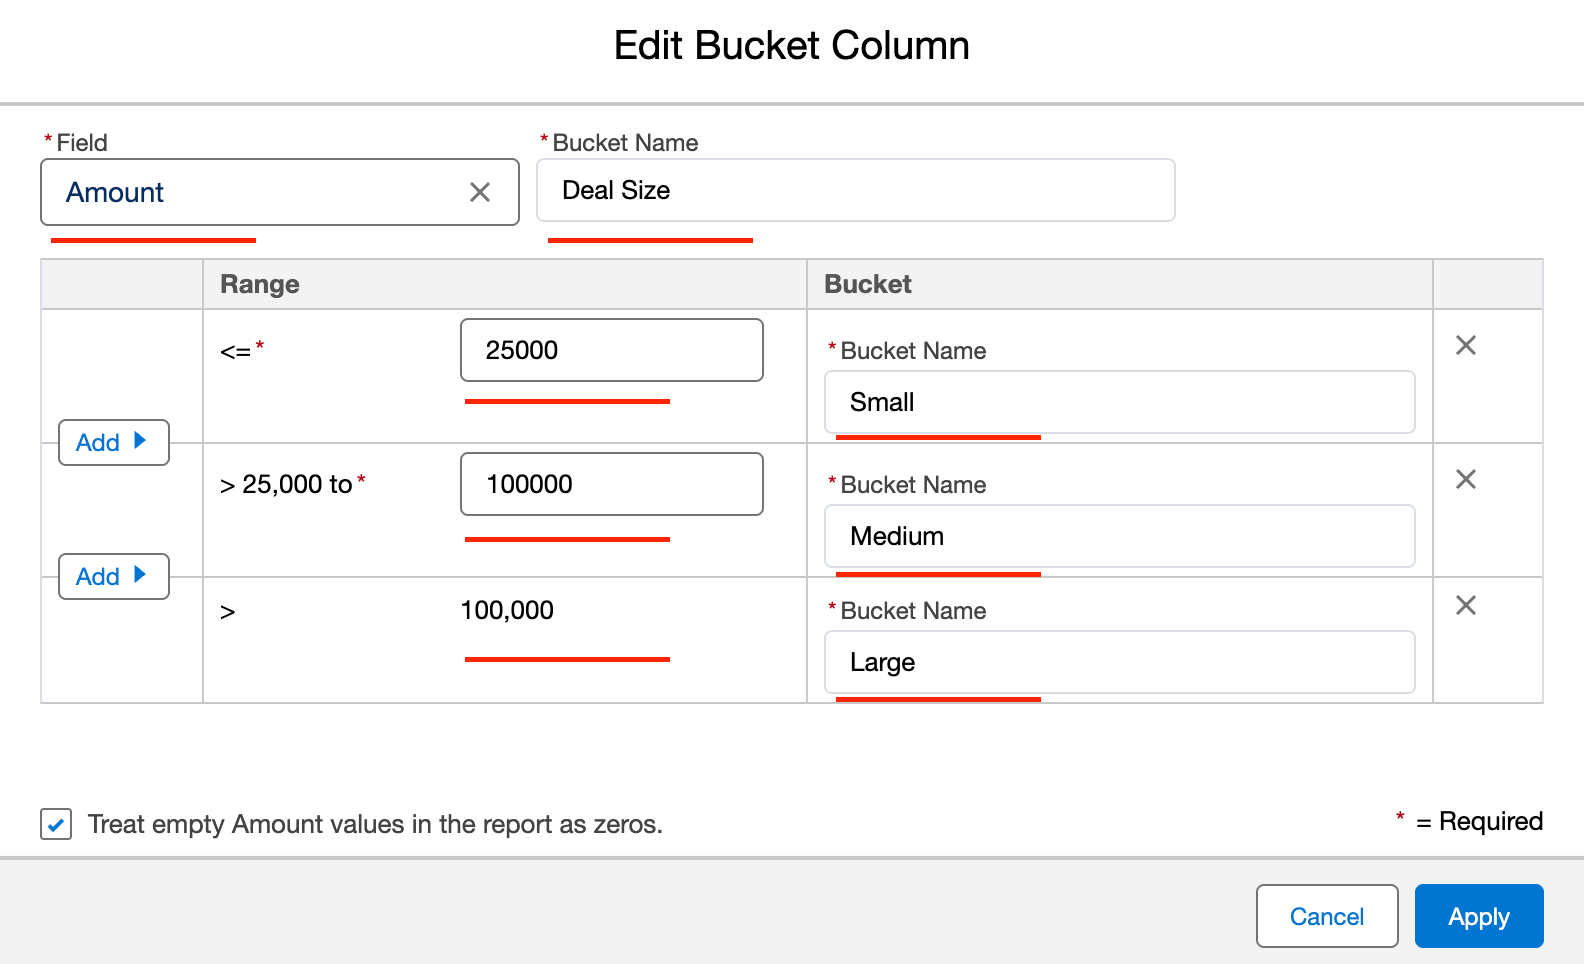
Amount - Define your buckets
- Name the first one “Small” → set max value to $25,000
- Add a second bucket “Medium” → from $25,001 to $100,000
- Add a third one, “Large” → from $100,001 and above
- Click “Apply”
Features of Bucket Fields as Advanced Salesforce Report Features
- Create custom groupings on the fly, no need for formula fields or picklist changes
- Supports numbers, picklists, and text fields
- Ideal for dashboards
10. Unique Count
What is Unique Count?
Unique Count lets you count the number of distinct records in a report column. So, instead of just showing the total number of rows. This is especially helpful when records appear multiple times due to joins, groupings, or related lists.
Example and Steps to Add Unique Count
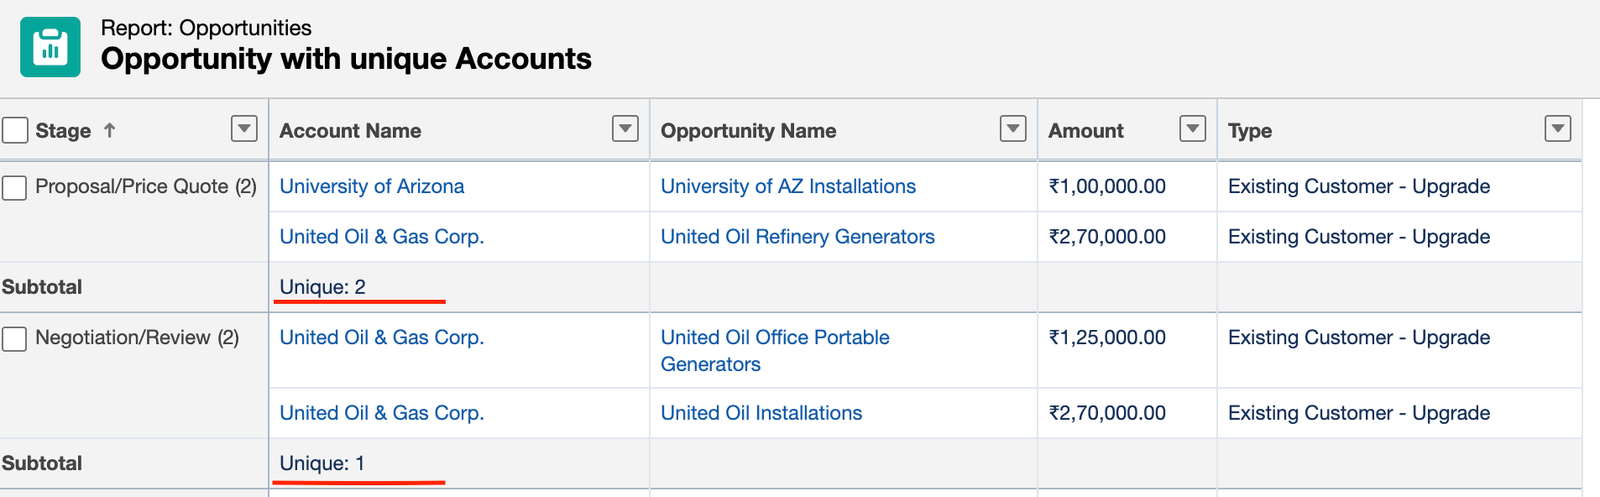
Let’s say you’re building a report to track how many different Accounts there are for each stage of all the opportunities. Since one account can have multiple opportunities, the total row count will be boosted when grouped by stages. Hence, using Unique Count on the Account Name field solves this instantly.
Steps: Add Unique Count
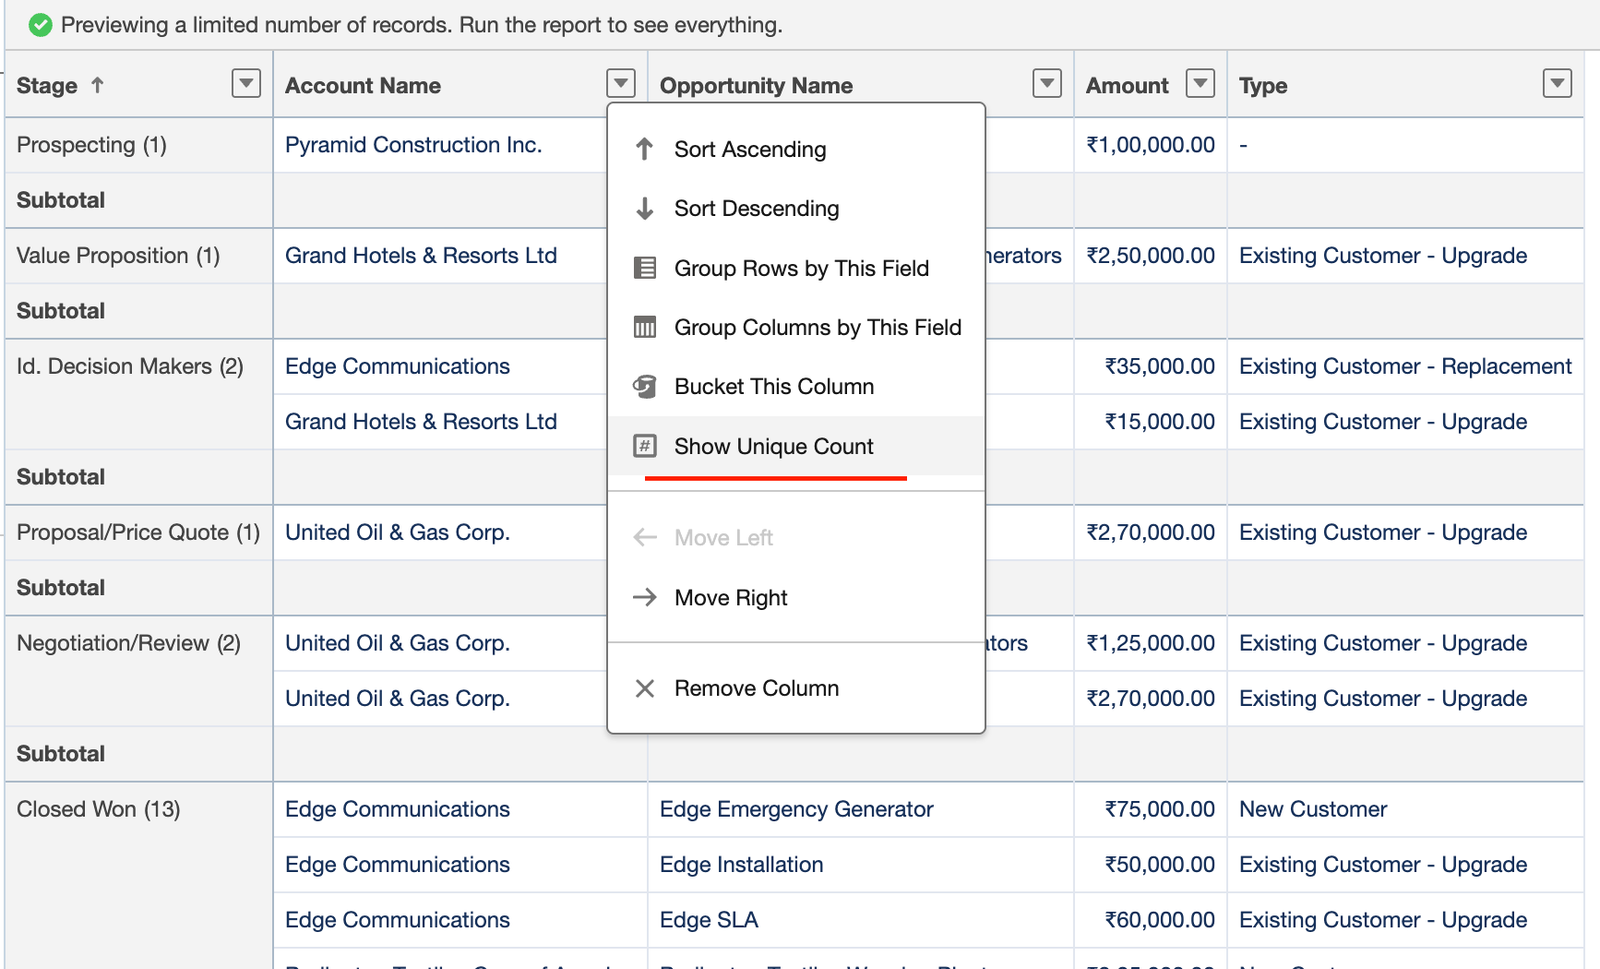
- Go to the Report Builder
- Drag in the field you want to count uniquely (for this case, Account Name)
- Click the field’s dropdown menu
- Select “Show Unique Count”.
Features of Unique Count as Advanced Salesforce Report Features
- Counts only distinct values in a selected field.
- Helps avoid duplicate records in reports.
Read more – When to use Salesforce Flow vs Apex
FAQs
1. Why should I use advanced reporting features in Salesforce?
They help you gain deeper insights, track changes over time, identify data issues, and customise reports to meet your exact business needs.
2. What’s the difference between Row-Level and Summary Formulas?
Row-Level formulas work on each record individually, while Summary Formulas calculate across grouped records or totals.
3. How do Cross Filters help in reports?
They let you include or exclude records based on related data like Accounts without Opportunities, which standard filters can’t do.
4. Can I track changes over time in reports?
Yes, use Historical Trend Reporting or Reporting Snapshots to compare how values change over days, weeks, or months.
5. What if I don’t see some of these features?
Check your report format, user permissions, and whether the feature (like Historical Trending) needs to be enabled in Setup.
Conclusion
Advanced reporting features in Salesforce turn raw data into real insights. With tools like Custom Report Types, Row-Level Formulas, and Trend Reporting, you can go beyond surface-level metrics and uncover what really matters. Small changes in how you report can lead to smarter decisions and a big impact.